QUANT · MARCH 2026
NVDA 上卖期权能跑赢直接持有吗
Can selling NVDA options beat just holding the stock?
中文
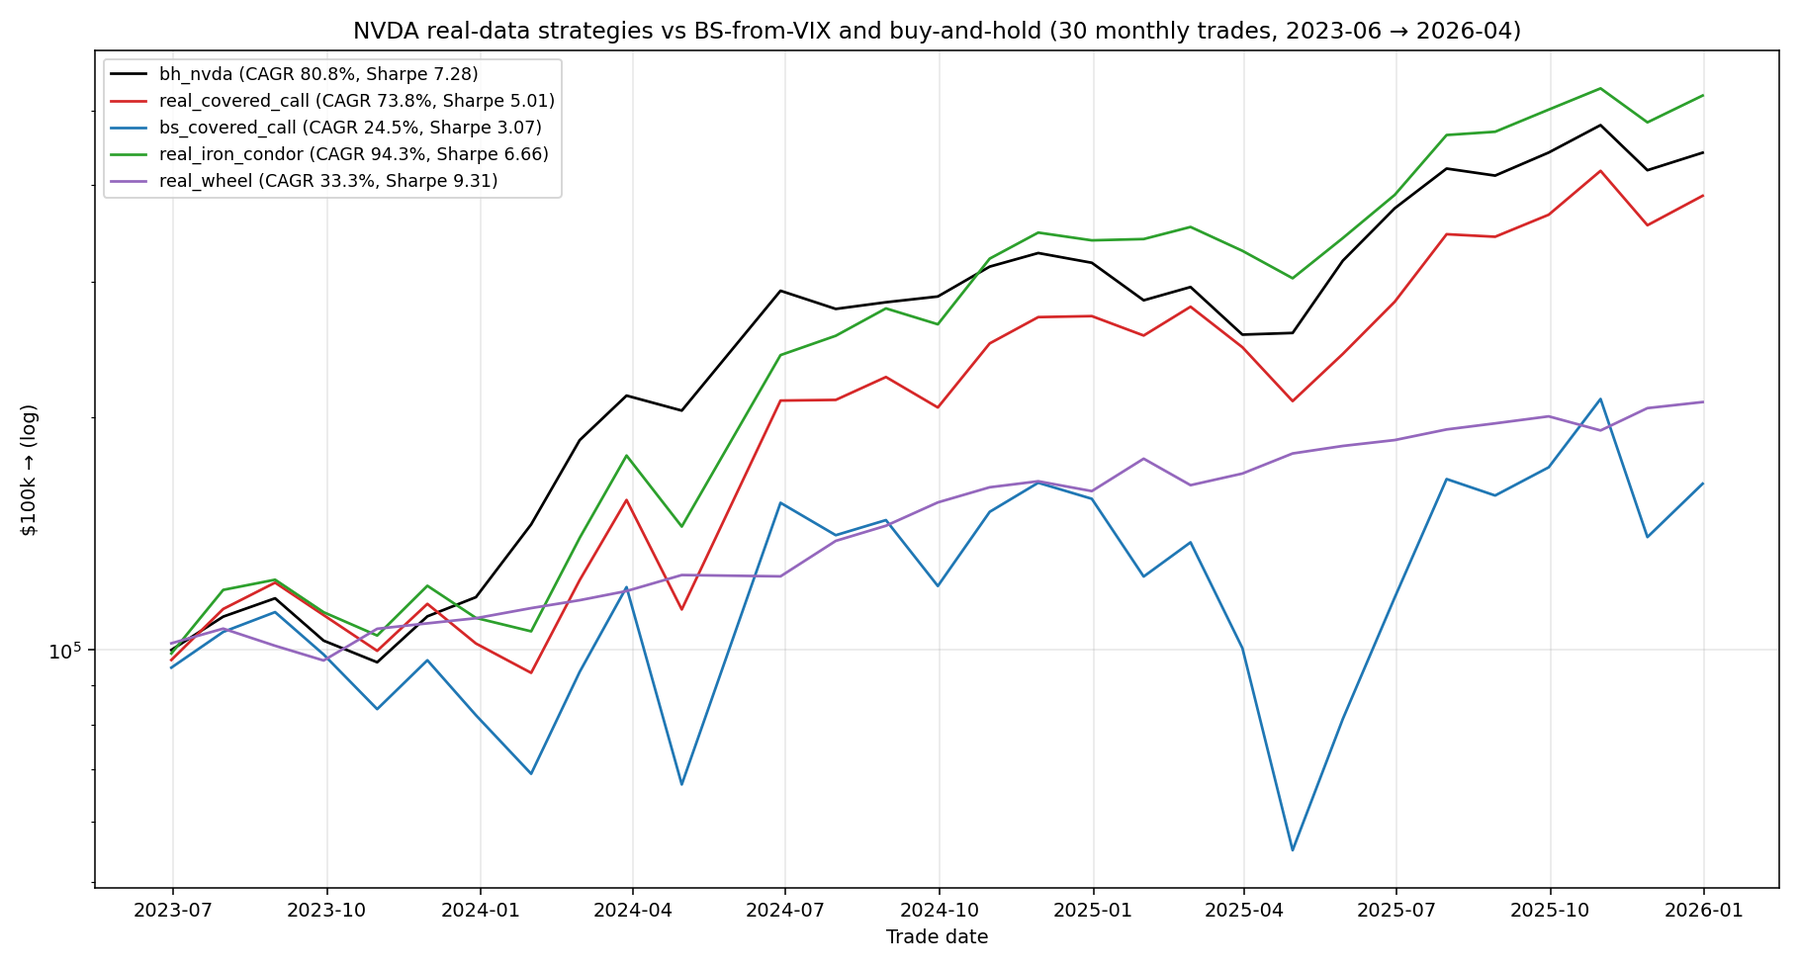
跑完一系列 SPY(S&P 500 指数 ETF)上的卖期权 backtest 之后基本是同一个结论:risk-adjusted(单位风险下的收益,比如 Sharpe)比纯持仓好,但绝对收益打不过 buy-and-hold(直接买入并长期持有)。NVDA 是整个 repo 里唯一的反例——单只股票上 sell options(卖期权收 premium 当 income)干净打赢底层,所以单独拎一篇出来讲,顺便把“为什么是 NVDA、能不能复制到别的票”这件事讲清楚。数据用的是 2023-06 到 2026-01 这 2.5 年的真实 NVDA 期权报价,正好 cover 了 AI 浪潮起来到上一轮调整。下面所有结论都是最近 regime 的,不是 30 年长期常量。
NVDA 从 2023 年中到 2026 年初翻了 3 倍。直接持有股票年化 81%。同期每个月卖 covered call(持股 + 卖一个 call 期权,把超出某个 strike 的上涨封顶,换 premium 现金)反而亏了 7 个点的 CAGR(年化复合收益率)——cap on upside 在 NVDA 飞涨的时候咬得太狠。但是如果你同时卖 call 和 put(双向各 5% OTM 的 “iron condor”——OTM = out-of-the-money,strike 离现价 5% 远;iron condor = 同时卖一个高位 call 和一个低位 put,赌价格在两个 strike 之间),年化 94%,回撤还比纯持 NVDA 浅。原因是结构性的:NVDA 的期权市场对保险定价过高,即使每隔几个月被 NVDA 暴涨咬一口,累计 premium 也足够 compensate。
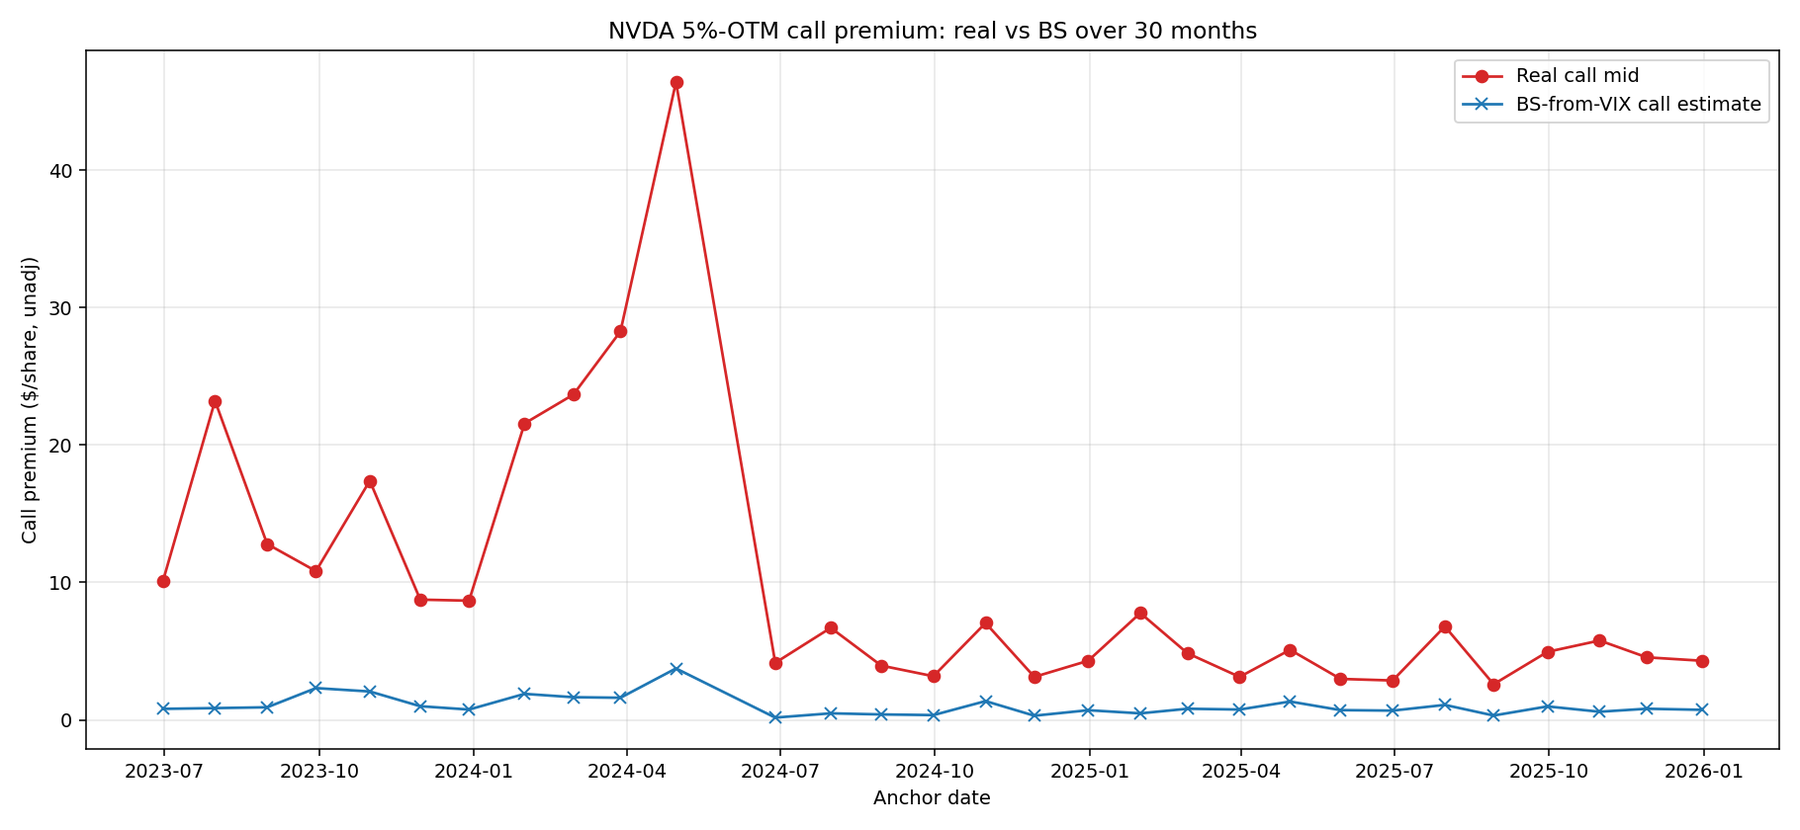
第二个同等重要的发现:教科书的方法(Black-Scholes 用 VIX 当 implied vol)比真实 NVDA premium 低估了 9-14 倍。如果你用这个方法在 simulator 里 backtest,结论会是策略亏钱——但真实市场上策略赚 94%。
短答
| 策略 | 30 trades 后 CAGR | Sharpe | MaxDD | $100k → |
|---|---|---|---|---|
| 纯持 NVDA | 80.8% | 7.27 | −21.6% | $441k |
| Real covered call | 73.8% | 5.01 | −27.9% | $388k |
| Iron condor (real) | 94.3% | 6.66 | −19.1% | $523k |
| BS+VIX covered call | 24.5% | 3.07 | −66.6% | $164k |
| Wheel | 33.3% | 9.31 | −9.1% | $210k |
两个最重要的对比:
1. Iron condor 在 30 个月里赚了 $523k,纯持 NVDA 是 $441k。差 $82k。同时 MaxDD 还浅 −19% vs −22%。Calmar 4.94——是整个 repo 里最高的数字。
2. BS+VIX covered call 在同样的设定下“只赚” 24.5% CAGR——同期 real 数据是 73.8%。用错了 vol input 导致策略看起来在亏钱,实际上真实 premium 远高于模型估计。
Iron condor (或者准确说 “short strangle”) 是什么
两件事同时做:
- 卖一个 5% OTM 的 call——收 premium。如果 NVDA 涨过 strike,你要赔。如果没涨到,你保留 premium。
- 卖一个 5% OTM 的 put——同理但镜像。如果 NVDA 跌穿 strike,你要赔。否则保留 premium。
两个一起跑,等于在 NVDA 当前价上下各 5% 圈了一个价格走廊。如果 NVDA 那一个月内待在走廊里,两个 premium 都进你兜——干净的胜利。如果跑出走廊,一边赔钱、另一边赚。
术语注解:option 圈子叫这个 short strangle(没有保护翼)或者 iron condor(加保护翼把 max loss 锁定)。我们的 backtest 是 naked 版本(没翼)。但 retail platform 普遍用 “iron condor” 概括两种。下面通用“iron condor”指我们 backtest 的 short strangle 版本。要在 Reg-T 账户里跑,必须用带翼的 iron condor。
几个术语
- CAGR — 年化复合回报。NVDA 80.8% over 2.5 年 ≈ 翻 3 倍
- Sharpe — 单位波动收益。1 以上算好,5+ 罕见
- MaxDD — 最差从峰值到谷值的损失
- Calmar — CAGR / drawdown 深度
- IV (implied volatility) — 期权价格里隐含的波动率。把 Black-Scholes 反向解出来的 σ
- VIX — S&P 500 一个月期权的 IV。常被误用为所有股票的“恐惧指标”
- 5% OTM — strike 在标的当前价格的 ±5% 位置
我们测了啥
30 个连续月度 trades,2023 年 6 月到 2026 年 1 月,用 ThetaData 抓的 NVDA 真实 EOD option 报价。每个 trade:
- 月末最后一个交易日,找到下一个月度到期
- Call strike 选离当前价 +5% 最近的
- Put strike 选 −5% 最近的
- 读真实 mid 价格(不是模型估计)
- 持到到期。按 NVDA 到期日收盘价结算
测了 5 个 strategy variant:buy-and-hold、real covered call、BS+VIX covered call(“教科书版本”)、iron condor、wheel。
2024-06-10 的 10:1 拆股做了正确处理:拆股前 contract 的 per-share P&L 按拆股前的 dollar 换算上去;拆股后 contract 用直接 per-share math。一个 contract 跨拆股期被丢弃。4 个 anchor 缺有效报价被丢弃。30 个干净 trades。
为啥卖 NVDA option 真的能赚钱
教科书 option 理论不会告诉你的核心事实:NVDA option 在我们这个窗口里被市场系统性 over-priced。
30 个 trades 累计 premium 收入:
| 方向 | 真实总 premium (per share, 30 trades) | BS+VIX 估出来的 | 比例 |
|---|---|---|---|
| Call | $299.81 | $30.56 | 9.81× |
| Put | $256.94 | $18.56 | 13.84× |
差不多 10 倍。为什么?
NVDA 在这段时间的 ATM IV 平均约 45-50%。VIX 平均 16-17%。所以教科书用错了 vol input——用了实际值的三分之一。option price 对短期合约 roughly 跟 σ 线性比例,所以 3× IV 比例直接造成 3× 的 premium gap。再加上 “smile”(OTM option 比 ATM 价更高)贡献 1.5-2×。乘起来 4-5×。我们看到 9-14×,剩下来自 NVDA-specific event risk(财报、AI 竞争、供应链)——这些 VIX 完全看不到。
策略能赚钱的原因是:市场支付你 10 倍模型估的 premium,但 NVDA 实际波动并不支撑这个价格。这就是 edge。
一句话教训:不要把 VIX 当单股 IV 输入。要用单股自己的 IV surface,没有数据就别跑这个 backtest。
哪些月份亏了
30 个 trade per-share P&L 的模式:
- 18/30 trades 是净正的。大部分月份 NVDA 不会涨穿 +5% 也不会跌穿 −5%,两个 wing 都过期,留下两份 premium。
- 12 个月 call 那条腿亏——NVDA 涨过 +5% strike。最差 3 个:2024-04 (−$145/share)、2024-01 (−$156)、2023-12 (−$82)。NVDA 那些月份涨了 15-35%。
- 6 个月 put 那条腿亏——NVDA 跌过 −5%。最差:2023-08 (−$23)、2025-10 (−$8)。put 端损失比 call 端小很多——NVDA 分布右偏(大涨的幅度比大跌大)。
策略撑过去的原因是:call 受伤的月份,put 几乎肯定 expire worthless,赚一份 premium 抵消一部分 call 损失。月度组合下来净正的比净负的多,长期 premium 累积超过了损失。
可以这么类比:你在经营一家小保险公司。大部分保单不付钱。少数季度有大灾难,你赔钱。只要长期收的保费超过赔出的钱,你就是一家赚钱的保险公司。NVDA 2023-2025 的期权市场在付你凯迪拉克级别的保费,而保单上是本田思域级别的赔付。
为什么 wheel 在 NVDA 上严重跑输
Wheel 在 NVDA 上跑出 33% CAGR,$210k——纯持 NVDA 的一半都不到。听起来已经不错——但记住同期 NVDA 涨了 250%。
机制:wheel 80% 的时间在 cash phase 等 put assign。NVDA 一路猛涨,put 几乎从来不 assign,所以你大部分时间在收 ~5% 的现金利息 + 几个点的 put premium。Wheel 只在 put assign 的 20% 时间真正持有 NVDA shares——而那段时间 call 又频繁 assign,把你 flip 回 cash。
结果:wheel Sharpe 9.31(最高),但那是 insurance product Sharpe,不是 wealth Sharpe。最终 $210k 不如纯持 $441k 的一半。
“我真要跑这个策略需要多少 capital”
94% CAGR 的 headline 暗中假设你可以不锁定全部 strike 价值作为 put 的抵押。Reg-T 账户做不到这一点。NVDA 现价 $200 时的抵押大致:
- Reg-T margin (大部分 retail):5% OTM put @ $190 strike 大约要锁 $19,000 抵押(put strike 全额)。你收的 $15 premium 摊到 $19k 抵押上 = 一年大约 1%。意义有限。
- Portfolio margin (PRO 账户, 一般 $100k+ 净资产):broker 按整个组合的 risk 评估保证金,同一个 put 可能只占 $3,000-5,000 buying power。同样 $15 premium 摊到 $3k = 一年大约 6%——再加上释放的资金可以同时开 5 倍的仓位。
backtest 的 94% 数字本质是 portfolio margin 数字。Reg-T 账户里实际 CAGR 大约 15-25%——还是有吸引力,但远没那么戏剧化。
如果你没有 portfolio margin,还是可以跑,只是仓位上限远低于 backtest 暗示的水平。开一张 contract,跑半年,再决定要不要 scale。
财报月份要不要交易
NVDA 每年 4 次财报(2、5、8、11 月)。财报前后:
- ATM IV 飙 20-40 个百分点(从 ~45% 涨到 65-85%)
- 标的常常在隔夜跳动 5-15%
- 错位的那条腿付出代价
我们 backtest 里 2024 年 4 次财报里有 3 次打穿 5% OTM call 腿,每次大约 $50/股损失。2025 Q1 财报损失 $80/股。年化下来财报月对 call 腿造成 $200-300/股伤害。
三种处理财报月的方式:
- 直接 trade through:收高 premium,接受一条腿肯定挨打。Backtest 是这个版本。
- 跳过财报月:那个月不开仓。损失四分之一 trade count,但避免 80% 的灾难性 call 损失。预期累计 P&L 大约是 trade-through 版本的 50-60%。
- 拉宽 strike:财报月卖 10% OTM 而不是 5%。Premium 少 30%,但打穿率从 ~50% 降到 ~10%。介于 trade-through 和 skip 之间。
Backtest 用了第一种。换成二、三种可能更优——未来 Exp 候选。
“如果换 strike 距离呢”
我们测的是 5% OTM。其他距离的粗略直觉(NVDA 完整 sweep 还没跑——后续 Exp 候选):
- 3% OTM:premium 约翻倍,但 strike 在约 50% 的月份会被打穿。spike 月份是灾难
- 5% OTM(这个研究):平衡点——94% CAGR、Sharpe 6.66
- 7% OTM:premium 约半,打穿率 ~20%。Sharpe 估计相近,CAGR 低
- 10% OTM:premium 约 1/4,几乎不打穿。Sharpe 4-5,CAGR 30-40%
3-5% OTM 是经验上的 sweet spot。
Iron condor、Iron fly、Naked strangle 哪个对
Backtest 跑的是 naked(无保护翼)。意味着如果 NVDA 隔夜跳 50%,你要赔 strike 跟收盘的差额,没有 cap。这是大部分 retail broker 不会让你做的尾部场景。
带翼版本 = 同时买一个更远 OTM 的 call(比如 10% OTM)和更远 OTM 的 put。翼会吃掉 30-50% 的 premium,但把 max loss 锁死。CAGR 可能掉到 40-60% 区间,但策略变成 Reg-T 友好,max drawdown 也按比例减小。
大部分 retail 应该用带翼的 iron condor,不是 naked。用 backtest 数字当上限,不是目标。
税务能吃掉一半
taxable 账户里每收的 premium 都是 STCG,按 ordinary income 交税。加州 top bracket 联邦 35% + 州 10% = 综合 45%。
| 税前 | 联邦 35% STCG 之后 | 联邦+加州 45% 之后 |
|---|---|---|
| 94% CAGR | ~61% | ~52% |
税后 NVDA iron condor 大约 52% CAGR(加州 high earner)——还是惊人,但 headline 94% 是 Roth IRA 数字,不是 Schwab brokerage 数字。
要跑这个策略 + 有 IRA 容量 → 放 IRA。这对 repo 里每个 option-selling 策略都成立,但 NVDA 这个数字差距最大。
什么会让策略失效
3 个 regime shift 会破掉 NVDA iron condor 的 edge:
- NVDA IV 压缩到 SPY 水平。如果 AI 炒作冷却、NVDA 变成“无聊的大盘股” IV 从 47% 降到 25%——premium 减半,edge 也减半。
- 尾部风险频率上升。NVDA 开始更频繁出 20%+ 月度移动(中国关税、AI 泡沫破、产能过剩)——call 腿挨打的频率超过 premium 能补的速度。
- 财报移动比 implied 还大。现在 NVDA 财报 IV 正好够 cover 实际 move。如果反过来(IV 看着贵,但 realized variance 更高),edge 翻负。
这是 regime-dependent 的交易,不是永久 inefficiency。
这个能 generalize 到其他股票吗
短答:几乎不行。
Exp 42 在 4 个高 IV 名字 (AAPL, NVDA, TSLA, GOOGL) 上跑同样的 mechanic。只有 NVDA 干净打赢 buy-and-hold。TSLA 60% IV 也很高,但 IC 跑输。AAPL、GOOGL 都跑输。Portfolio 平均也跑输股票本身。
结论:NVDA 在这个窗口里有结构性高估的 premium——retail 大量买 call、财报波动、AI 叙事拉高 implied vs realized。这些条件是 NVDA 特定的。其他“高 IV”名字的 IV 高是因为现实价格也乱跳,卖 premium 不是免费午餐。
可能候选(值得测,没测过):MSTR(BTC 代理炒作)、SMCI、PLTR。不太可能的:TSLA(已测,没用)、AAPL(premium 太贴近 realized vol)。
行为成本
这个策略最大的敌人是跑它的人。
NVDA 月度 P&L 是双峰分布:~60% 的月份小赚 (+1% 到 +3%),~10% 的月份大亏 call 腿 (−10% 到 −30%)。当你在 −15% 月度回撤里看着 NVDA 又涨了 20%——策略看起来已经废了。是教科书的“我早说过卖 momentum 股 option 是 stupid”时刻。
94% CAGR specifically 要求坐穿 2024 Q1 那 $156/股月度亏损。任何在 2024 Q2 cut 掉策略的人错过反弹、锁住 30-50% drawdown。
要跑这个,进场前写下规则:
- 单月坏不 cut
- 6 个月累计 P&L 评估一次,不是单笔
- 预定仓位规模。好月份不加,坏月份不减
策略对事先决定了坏月份怎么办的 trader 有效。对在坏月份现场决定的 trader 无效。
我会怎么操作
如果我真要把这个放进 portfolio:
- 没有 portfolio margin 就别做。Reg-T 抵押吃掉 headline return。$100k+ 才有资格 qualify。
- 跑带翼版本,不是 naked strangle。10% OTM 翼吃 30% premium,换硬 cap on loss。值得。
- 跳过财报月或者拉宽 strike。两种都大致砍掉一半最坏月份,对 total return 影响小。
- 用真实 option mid,不要用模型估。拿不到真实数据就别 scale 仓位。
- 放 IRA。税差近一半 return。
- Sizing 让单月 30% loss 能扛。大约 NVDA 等效 notional 的 20%,不是 100%。
- 进场前写下 “我不慌” 规则。看得见的位置。
- 每 6 个月重新评估 edge。Edge 来自 NVDA 当前 inflated IV。当 IV 压缩到合理价位,edge 死。那时候停。
一些技术细节
- 只有 30 个月数据。NVDA 2023-06 到 2026-01 是个特殊牛市。包含 NVDA bear leg 的未来窗口 call 腿表现可能不一样
- Backtest 无摩擦。30 个 trades × 5-10 bps 往返 → 一年几个 bps 成本。对 IC 影响小,对 wheel 影响大
- Put 腿假设 cash-secured。真实 portfolio margin 下 effective CAGR 大约 60-70% 不是 94%
- 固定 30 DTE。短 DTE 在 SPY covered call 上更优(Exp 37 结论),NVDA 上没专门测
- NVDA-specific premium 富集。AAPL 上 BS-VIX gap 是 ~2×,NVDA 是 9-14×。其他名字中间
- 财报集中。NVDA 最大 move 经常在财报。Skipping earnings month 可能是免费 improvement,没专门测
文件
experiments/exp_33_real_nvda_strategies.py-
trades.csv— 30 个月度 trades 含真实 + 模型 premium + payoffs -
summary.csv— 5 个 strategy 的 CAGR / Sharpe / MaxDD / Calmar -
plots/equity_curves.png— 每日 equity -
plots/real_vs_bs_premium.png— 真实 vs 模型 premium 对比 -
plots/strategy_pnl_per_trade.png— 每月 P&L 柱状
English
The SPY (the S&P 500 index ETF) option-selling backtests in the rest of this repo all land on the same conclusion: risk-adjusted return (return per unit of risk, e.g. Sharpe) goes up, absolute return doesn’t beat buy-and-hold. NVDA is the one exception — the single name where selling options (collecting premium as income from option buyers) cleanly beats holding the underlying — so it gets its own post, and a real look at why it’s NVDA and whether the result transfers anywhere else. The data is 2.5 years of real NVDA option quotes from June 2023 to January 2026, which spans the run-up of the AI rally and the pullback that followed. Every finding below is a recent-regime result, not a long-run constant.
NVDA tripled between mid-2023 and early-2026. Owning the shares earned about 81 % per year. Selling a covered call (holding the shares plus selling a call option to cap the upside above some strike in exchange for cash premium) against those shares each month lost you 7 percentage points of CAGR (compound annual growth rate); the cap on upside bit hard when NVDA ripped. But if you sold a call AND a put each month — both 5 % away from the current price (out-of-the-money, OTM, in options jargon; selling both at once is an “iron condor,” betting price stays inside the two strikes) — you earned 94 % per year, with a shallower drawdown than just owning NVDA. The reason is structural: NVDA’s option market was systematically over-paying for protection, so even after eating big losses when NVDA ripped, the cumulative premium more than compensated.
The second finding is just as important: the textbook way to estimate single-stock option premium (Black-Scholes with VIX plugged in) was 9-14× too low. Anyone running this strategy in simulation using that method would have rejected it as unprofitable — and missed the trade.
The short version
| Strategy | CAGR over 30 trades | Sharpe | MaxDD | $100k → |
|---|---|---|---|---|
| Buy-and-hold NVDA | 80.8 % | 7.27 | −21.6 % | $441 k |
| Real covered call | 73.8 % | 5.01 | −27.9 % | $388 k |
| Iron condor (real) | 94.3 % | 6.66 | −19.1 % | $523 k |
| BS+VIX covered call | 24.5 % | 3.07 | −66.6 % | $164 k |
| Wheel | 33.3 % | 9.31 | −9.1 % | $210 k |
Two key comparisons:
1. Iron condor earned $523 k over 30 months. Plain NVDA earned $441 k. A $82 k gap. With a shallower drawdown (−19 % vs −22 %). Calmar 4.94 — the highest number in the entire repo.
2. BS+VIX covered call shows 24.5 % CAGR for the same setup — actual real-data CC returned 73.8 %. Using the wrong volatility input makes the strategy look unprofitable when real premium is 10× the modeled estimate.
What’s an iron condor (technically a “short strangle”)
Two things at once:
- Sell a 5 % OTM call. Collect premium. Pay if NVDA closes above strike at expiry.
- Sell a 5 % OTM put. Mirror image. Pay if NVDA closes below strike.
Together you box a price corridor ±5 % around the current price. If NVDA stays inside the corridor that month, you keep both premiums — clean win. If it breaks out, one side pays, the other still collects.
Terminology: option traders call this a short strangle (no protective wings) or an iron condor (with further-OTM long wings capping max loss). Our backtest is the naked version (no wings). Retail platforms use “iron condor” loosely for both. We use “iron condor” throughout to match common usage — but for a Reg-T account, you’d want the wing-protected version (more below).
A few terms
- CAGR — annualized compound return. NVDA 80.8 % over 2.5y ≈ tripled.
- Sharpe — return per unit of volatility. Above 1 is good, 5+ is rare.
- MaxDD — worst peak-to-trough loss.
- Calmar — CAGR ÷ drawdown depth.
- IV (implied volatility) — the volatility figure embedded in option prices. Solving Black-Scholes backward from a real market price gives you σ.
- VIX — implied vol of 1-month SPX options. Often misused as a “fear gauge” for all stocks.
- 5 % OTM — strike is 5 % above (call) or below (put) the current price.
What we tested
30 consecutive monthly trades, June 2023 to January 2026, using real EOD option quotes from ThetaData. Each trade:
- Last trading day of the month, find the next monthly expiration
- Pick the call strike closest to +5 % above current price
- Pick the put strike closest to −5 %
- Read real mid prices (not modeled)
- Hold to expiry, settle at closing price
Five strategy variants: buy-and-hold, real covered call, BS+VIX covered call (“textbook version”), iron condor, wheel.
The 2024-06-10 10:1 stock split is handled correctly. One contract spanning the split was discarded. Four anchors missing valid quotes were discarded. 30 clean trades remain.
Why selling NVDA options actually works
The textbook option theory doesn’t tell you the core fact: NVDA options were systematically over-priced relative to realized vol in our window.
Cumulative premium collected over 30 trades:
| Side | Real premium per share (sum) | BS+VIX estimate | Ratio |
|---|---|---|---|
| Calls | $299.81 | $30.56 | 9.81× |
| Puts | $256.94 | $18.56 | 13.84× |
About 10× the model. Why?
NVDA’s ATM IV averaged ~45-50 % during this window. VIX averaged 16-17 %. So the textbook used the wrong vol input — a third of the actual value. Option price scales roughly linearly with σ for short-dated contracts, so a 3× IV ratio drives most of the 3× premium gap. The “smile” (OTM options priced even higher than ATM) adds another 1.5-2×. Multiply: 4-5×. We see 9-14×, so the remaining gap comes from NVDA-specific event risk (earnings, AI competition, supply chain) that VIX can’t see.
The strategy works because the market pays you 10× the modeled premium, while NVDA’s actual moves don’t justify a price that high. That’s the edge.
One-line takeaway: never use VIX as IV for single names. Use the underlying’s own IV surface. If you can’t get that data, don’t run the backtest.
Which months lost money
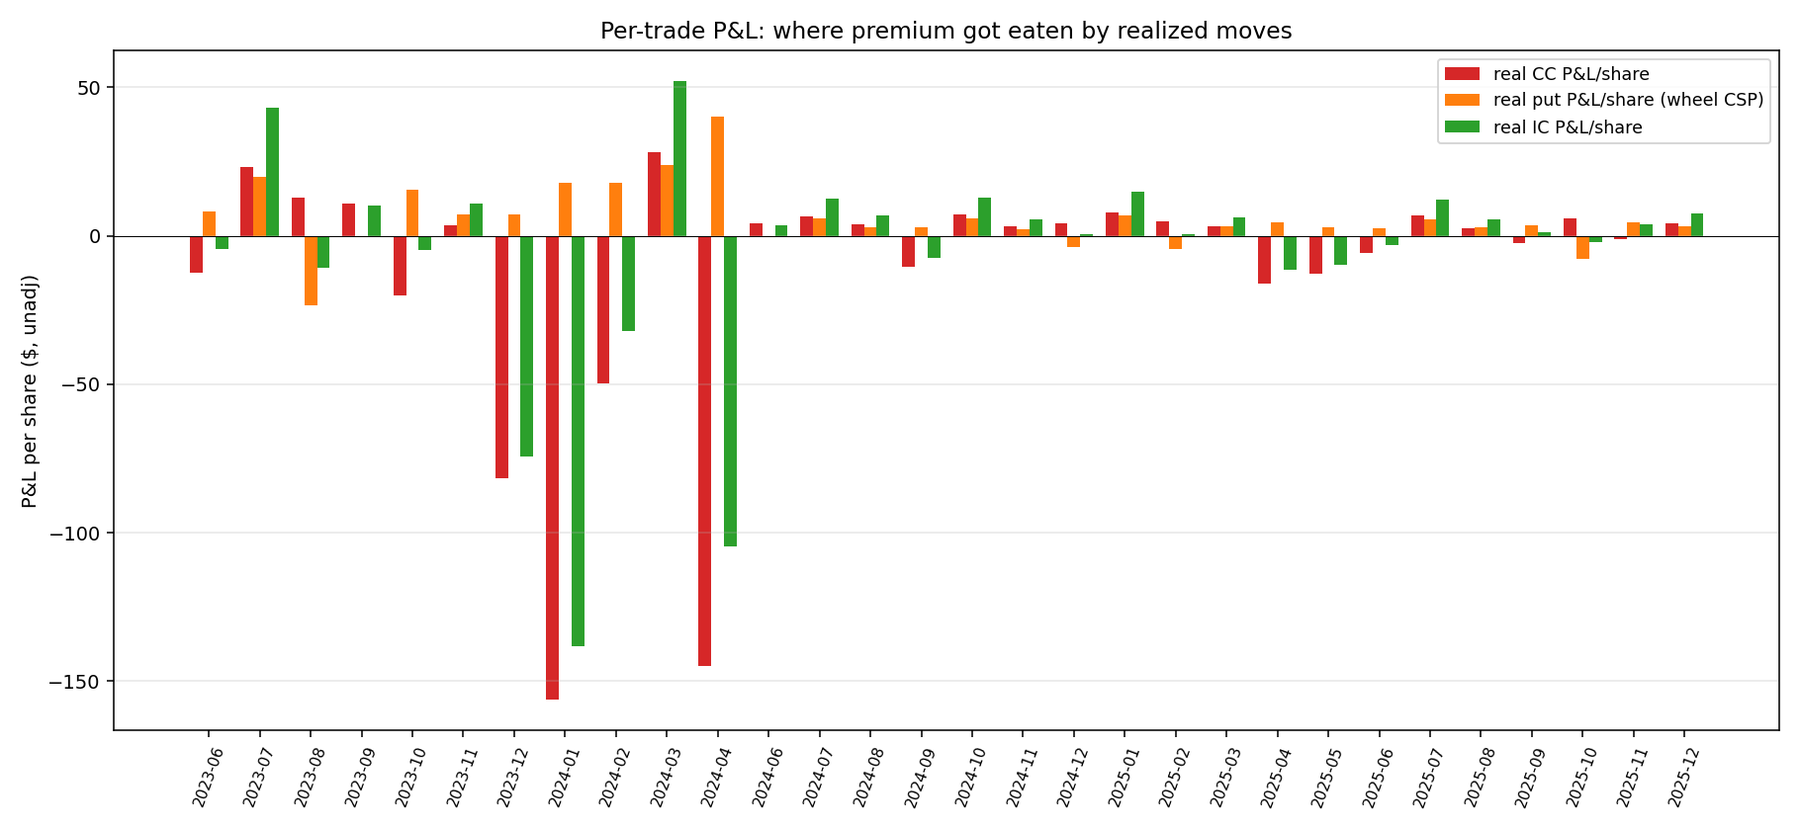
The per-trade P&L pattern:
- 18/30 trades were net positive. Most months NVDA neither rose past +5 % nor dropped past −5 %; both wings expired and we kept both premiums.
- 12 months the call leg lost. Worst three: April 2024 (−$145/share), January 2024 (−$156), December 2023 (−$82). NVDA ripped 15-35 % those months.
- 6 months the put leg lost. Worst: August 2023 (−$23), October 2025 (−$8). Put losses are much smaller than call losses — NVDA’s distribution skews right.
The strategy survives because when the call leg gets hit, the put leg almost always expires worthless and contributes positive P&L. More months were net positive than negative, and the long-run accumulation of premium exceeded the losses.
Think of it like running a small insurance company. Most policies pay nothing. A few quarters somebody has a really bad accident and you write a big check. As long as your premiums collected exceed your claims paid, you’re a profitable insurer. NVDA’s options market in 2023-2025 was paying you Cadillac premiums on Honda Civic claims.
Why the wheel underperformed badly on NVDA
The wheel on NVDA returned 33 % CAGR, $210 k — less than half what holding NVDA paid. Sounds good in isolation — but NVDA itself went up 250 % over the window.
Mechanism: the wheel sits in cash 80 % of the time waiting for puts to assign. NVDA marched up relentlessly, puts rarely assigned, so most of the time the strategy collected ~5 % cash interest + a few percent in put premium. The wheel only owned NVDA shares 20 % of the time — and during those stretches calls assigned frequently, flipping back to cash and missing the next rally.
Result: wheel Sharpe 9.31 (highest in the table). But that’s insurance-product Sharpe, not wealth Sharpe. The final $210 k can’t compete with B&H’s $441 k.
“How much capital do I actually need?”
The 94 % CAGR headline quietly assumes you can sell short puts without setting aside the full strike value as collateral. Reg-T accounts can’t do that. Rough collateral math with NVDA at $200:
- Reg-T margin (most retail): a 5 % OTM put at $190 strike requires roughly $19 000 of collateral (full put strike). Your $15 premium on $19 k = ~1 % a year. Material but not life-changing.
- Portfolio margin (PRO accounts, typically $100 k+ equity): broker risk-scores the whole position. Same put might block off only $3 000-5 000 of buying power. Now $15 premium = ~6 % a year on collateral — and you can stack 5× more positions with the freed capital.
The 94 % CAGR is a portfolio-margin number. In a Reg-T account the realistic CAGR is more like 15-25 % — still attractive, but not the screenshot-worthy figure.
If you don’t have portfolio margin, you can still run this, just at much smaller size than the backtest implies. Sell one contract, run it for 6 months, then decide whether to scale.
Earnings months are different
NVDA reports earnings 4 times a year (Feb, May, Aug, Nov). Around earnings:
- ATM IV balloons 20-40 percentage points (~45 % → 65-85 %)
- The stock often moves 5-15 % overnight
- Whichever leg is on the wrong side pays out big
In the backtest, 3 of 4 NVDA earnings in 2024 broke the 5 %-OTM call leg, costing ~$50/share each. The Q1 2025 earnings cost ~$80/share. Annualized, earnings-month damage is $200-300/share on the call leg.
Three ways to handle earnings months:
- Trade through. Collect inflated premium, accept that one leg will get crushed. (Backtest does this.)
- Skip earnings months. Lose a quarter of trades but avoid 80 % of catastrophic call losses. Cumulative P&L roughly 50-60 % of trade-through.
- Widen strikes in earnings months. Sell 10 % OTM instead of 5 % OTM. Premium ~30 % lower, binding rate ~10 % instead of ~50 %.
Backtest used the first version. Versions two and three are likely improvements — future Exp candidates.
“What if I widen the strikes?”
We tested 5 % OTM both sides. Rough intuition for other widths (full NVDA sweep not done — candidate Exp):
- 3 % OTM: roughly double the premium, strikes bind ~50 % of months. Catastrophic in spike months.
- 5 % OTM (this study): the empirical sweet spot — 94 % CAGR, Sharpe 6.66.
- 7 % OTM: ~50 % of the premium, binds ~20 %. Similar Sharpe, lower CAGR.
- 10 % OTM: ~25 % premium, almost never binds. Sharpe 4-5, CAGR 30-40 %.
3-5 % OTM is the empirical sweet spot.
Iron condor vs iron fly vs naked strangle
Backtest sold naked (no protective wings). If NVDA gapped up 50 % overnight, you’d owe strike-to-close with no cap. Most retail brokers won’t let you take that exposure.
The wing-protected version: same setup, but also buy a further-OTM call (say at 10 % OTM) and a further-OTM put. Wings cost 30-50 % of premium but cap max loss. CAGR probably drops to 40-60 % range, but the strategy becomes Reg-T eligible and max drawdown shrinks proportionally.
Most retail should run the wing-protected iron condor, not the naked strangle. Use the backtest number as an upper bound, not a target.
Taxes can take half
Every premium is short-term capital gains in a taxable account, taxed as ordinary income. California top-bracket: 35 % federal + 10 % state = 45 % blended.
| Pre-tax | After 35 % federal STCG | After full 45 % CA |
|---|---|---|
| 94 % CAGR | ~61 % | ~52 % |
After-tax CA NVDA iron condor ~52 % CAGR — still extraordinary, but the 94 % headline is a Roth IRA number.
Run this in an IRA if you have the capacity. True for every option-selling strategy in the repo, but the gap is biggest here.
What kills the strategy
Three regime shifts would break the edge:
- NVDA’s IV compresses to SPY levels. If AI hype cools and NVDA becomes a “boring mega-cap” with 25 % IV instead of 47 %, premium halves and so does the edge.
- Tail-risk frequency rises. If NVDA starts having 20 %+ monthly moves more often (China tariffs, AI bubble pop, capacity glut), the call leg gets crushed faster than premium can replace.
- Earnings moves grow larger than implied. Currently NVDA earnings IV is rich enough to cover actual moves. If that flips (vol becomes “expensive” but realized variance even higher), edge goes negative.
This is a regime-dependent trade, not a permanent inefficiency.
Does this generalize to other stocks?
Short answer: mostly no.
A separate experiment on 4 high-IV names (AAPL, NVDA, TSLA, GOOGL) running the same iron-condor mechanic showed only NVDA cleanly beat buy-and-hold. TSLA’s 60 % IV is high too but IC underperformed. AAPL and GOOGL underperformed. The portfolio average lost to a basket of the stocks.
Conclusion: NVDA had structurally over-priced premium during this window — retail call-buying interest, earnings volatility, AI narrative all pumped implied vs realized vol. These conditions are NVDA-specific. Other “high IV” names typically have high IV because they actually move that much, so selling premium isn’t a free lunch.
Plausible candidates worth testing: MSTR (BTC-proxy hype), SMCI, PLTR. Unlikely: TSLA (already tested, didn’t work), AAPL (premium too close to realized vol).
Behavioral cost
The biggest enemy of this strategy is the person running it.
NVDA’s monthly P&L is bimodal: ~60 % of months are small wins (+1 % to +3 %), ~10 % are big losses on the call leg (−10 % to −30 %). When you’re sitting in a −15 % monthly drawdown while watching NVDA rip another 20 %, the strategy looks broken. It’s the textbook “I told you so” moment.
The 94 % CAGR specifically requires sitting through Q1 2024‘s $156/share monthly loss. Anyone who cut the strategy in Q2 2024 missed the recovery and locked in a 30-50 % drawdown.
To run this, write down the rules before the first trade:
- Don’t cut after a single bad month
- Re-evaluate after 6 months of cumulative P&L, not after one print
- Pre-commit position sizing — don’t double up after good months, don’t halve after bad
The strategy works for traders who decided in advance what they’d do when it looked broken. It doesn’t work for the trader who improvises mid-drawdown.
What I would actually do
If I were putting this into a real portfolio:
- Don’t run this without portfolio margin. Reg-T collateral kills the headline return. Need $100 k+ equity to qualify.
- Run the wing-protected version, not naked. 10 % OTM wings cost 30 % of premium but hard-cap loss. Worth it.
- Skip or widen strikes for earnings months. Roughly halves the worst losses with smaller hit to total return.
- Use real option mids, not modeled. If you can’t get actual quotes, don’t size up.
- Run it in an IRA if you have capacity. Tax difference is roughly half your return.
- Size such that a 30 % loss month is survivable. That’s about 20 % of NVDA-equivalent notional, not 100 %.
- Write your “I won’t panic” rules on paper before the first trade. Keep them visible.
- Re-evaluate the edge every 6 months. The strategy works because NVDA IV is currently inflated. When it compresses to fair value, the edge dies. Stop trading then.
Boring stuff
- Only 30 months of data. NVDA’s 2023-06 to 2026-01 was a unique bull run. A future window including a NVDA bear leg may show different call-leg behavior.
- Frictionless backtest. 30 trades × 5-10 bps round-trip = a few bps/yr cost. Material to the wheel, immaterial to IC.
- Put leg assumed cash-secured. Real portfolio-margin execution yields closer to 60-70 % CAGR than 94 %.
- Fixed 30 DTE. Shorter cycles dominate for SPY (separate experiment) — likely true for NVDA but unverified.
- NVDA-specific premium richness. AAPL’s BS-VIX gap is ~2×, NVDA’s is 9-14×. Other names in between.
- Earnings concentration. Some of NVDA’s biggest moves are at earnings. Skipping the month with earnings might be a free improvement, untested.
Files
experiments/exp_33_real_nvda_strategies.py-
trades.csv— 30 monthly trades with real and modeled premiums + payoffs. -
summary.csv— CAGR / Sharpe / MaxDD / Calmar for all 5 strategies. -
plots/equity_curves.png— daily equity curves. -
plots/real_vs_bs_premium.png— per-trade real vs modeled premium. -
plots/strategy_pnl_per_trade.png— per-trade P&L bars.