QUANT · APRIL 2026
3 倍 ETF 真的能让你发财吗
Will leveraged ETFs actually make you rich?
中文
TQQQ(3 倍杠杆 Nasdaq-100 ETF,标的指数涨 1% 它涨 3%,跌 1% 它跌 3%)一直是雪球和 reddit 上被讨论最多的杠杆产品之一——“长期 Nasdaq 涨,3 倍杠杆就是 3 倍收益”这套说法每隔几个月就被重新搬出来。一直觉得这话哪里不对,但具体哪里说不清,所以把 2010 年以来的数据全拉出来跑了一遍。
跑出来第一个数字就比预期刺眼:2024 年 1 月 all in TQQQ 的人到今天年化 66%,2021 年 1 月 all in 的人年化 28%,中途账户跌过 82%。同一个产品,起步差 3 年的两个人,两段完全不同的人生。
杠杆 ETF 在 1-5 年视角里完全被择时决定。中位回报很惊人,但中位回撤也是惊人级别——TQQQ 任何一个 5 年滚动窗口的中位最大回撤是 −70%。如果你扛不住 70% 的回撤,这个产品不适合你,不管 CAGR 多高。
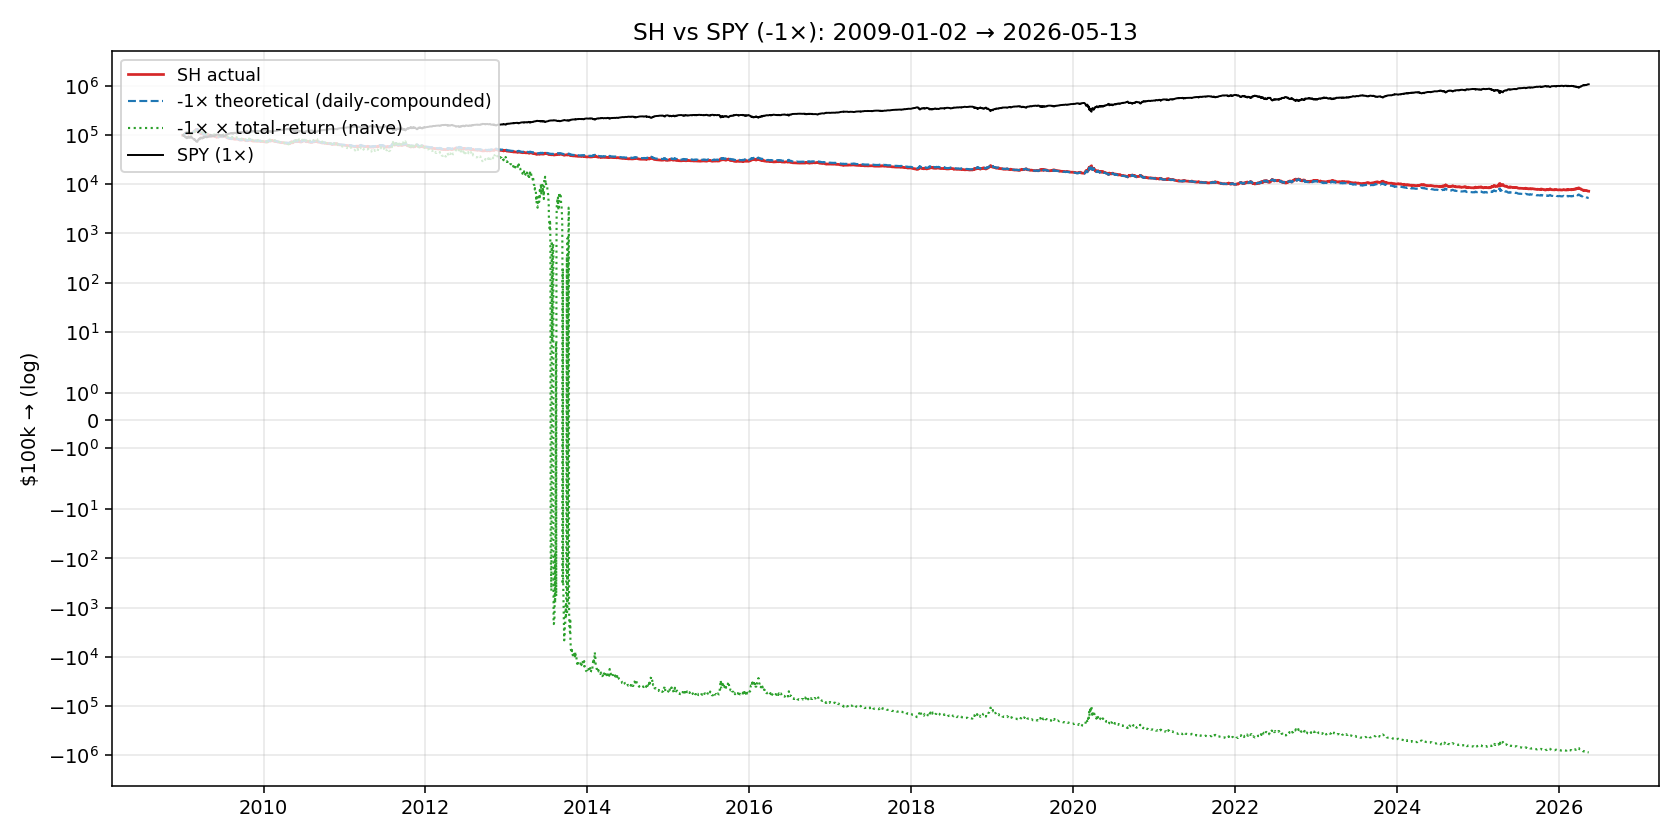
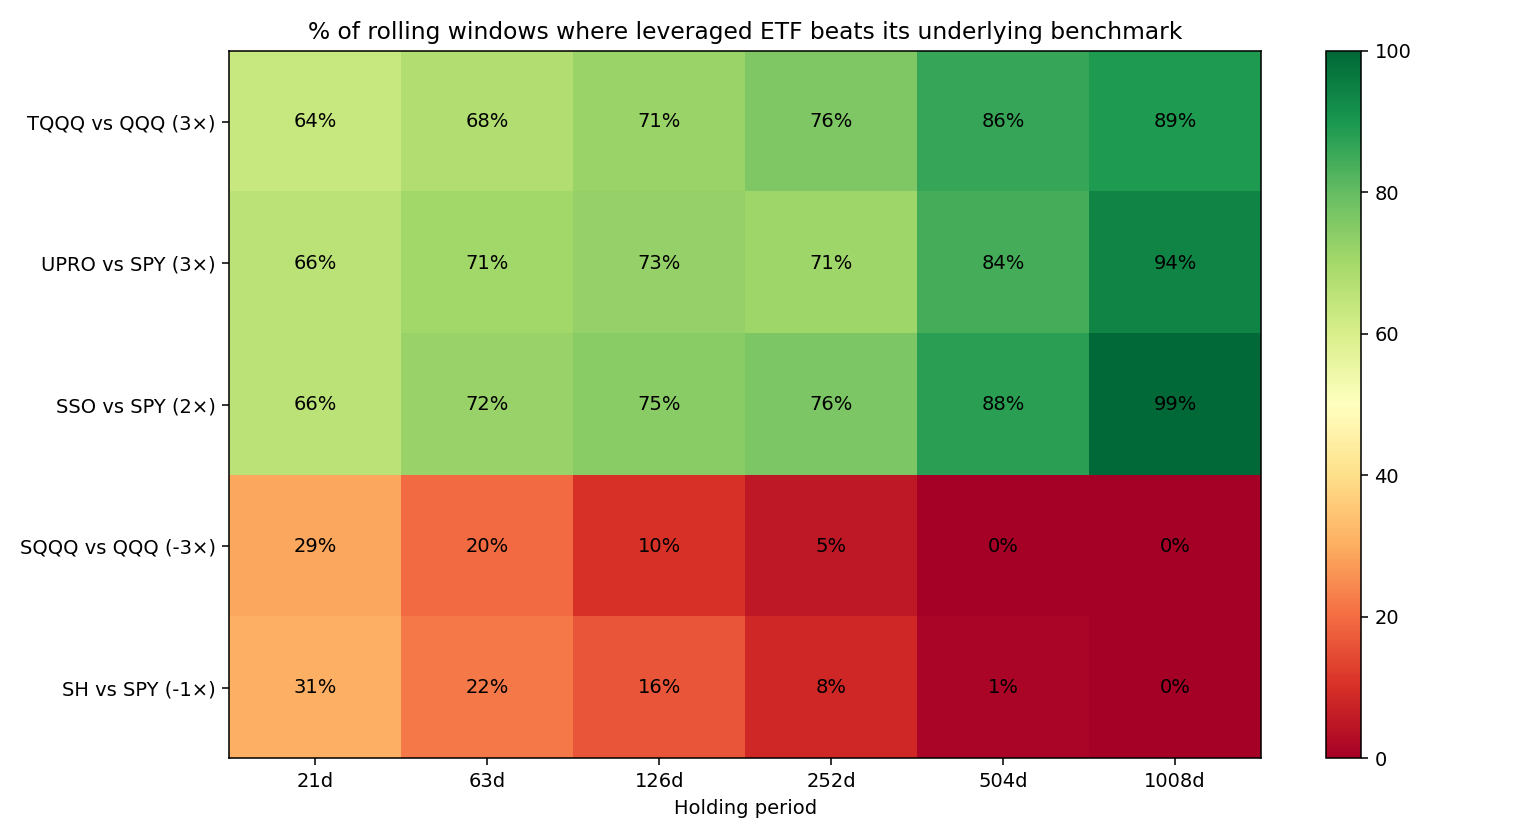
反向产品(SQQQ、SH)的故事更直接:过去 10 年所有 3 年期及以上的滚动窗口都亏钱。100% 的 3 年窗口,100% 的 5 年窗口——亏。
短答
| 起始 | 持有 | TQQQ | QQQ | UPRO | SPY | SSO | SQQQ |
|---|---|---|---|---|---|---|---|
| 2019 | 7.4y | 47% | 24% | 33% | 18% | 28% | −60% |
| 2021 | 5.4y | 28% | 18% | 29% | 15% | 24% | −49% |
| 2022 | 4.4y | 16% | 15% | 15% | 12% | 15% | −45% |
| 2024 | 2.4y | 66% | 28% | 51% | 22% | 38% | −57% |
(SH 跟 SQQQ 一样,CAGR 全是负的,−7% 到 −14% 不等。)
读这表的核心信号:TQQQ 在 2024 年起步 = 一年涨 66%。但 2021 年起步 = 28%——还要在中途看着自己的钱蒸发 82% 才能挺到这个数。Timing 是核心变量,不是杠杆倍数。
杠杆 ETF 到底是怎么工作的
三个 retail 经常搞错的关键事实:
1. 它瞄准的是单日倍数,不是长期倍数。TQQQ 想做到的事是“今天 QQQ 涨 1%,我涨 3%”。每个交易日收盘后 rebalance,第二天重置。不是说 QQQ 一年涨 20%、TQQQ 就涨 60%。
2. 它用衍生品(主要是 total return swap),不是直接持股加杠杆。TQQQ 不会去借 $200 买 $300 的 QQQ。它跟银行签 swap 合约——银行付 TQQQ “3 倍 QQQ 当日回报”,TQQQ 付银行融资成本(现在大约 5-6%/年)。这个融资成本是真的 cost,每天都在烧。
3. Compounding 是相乘的(multiplicative)。如果 QQQ 连续 4 天涨 1%、跌 1%、涨 1%、跌 1%,最终基本平。但 TQQQ 同样 4 天涨 3%、跌 3%、涨 3%、跌 3%——最终亏 0.36%。因为 (1.03 × 0.97)² < 1。这就是 vol drag。在 3 倍杠杆下被放大。
4. 反过来:如果 QQQ 连续 20 天都涨 0.5%、没有跌的日子,TQQQ 最终不是涨 30%(3 × 10%),而是涨 约 34%——daily compounding 的正向收益(positive convexity)。平滑上涨时杠杆帮你。震荡时杠杆害你。
具体哪种 regime 占主导,决定了你的实际收益。
四个产品到底是啥
| Ticker | 标的 | 倍数 | 上市 | Expense | AUM |
|---|---|---|---|---|---|
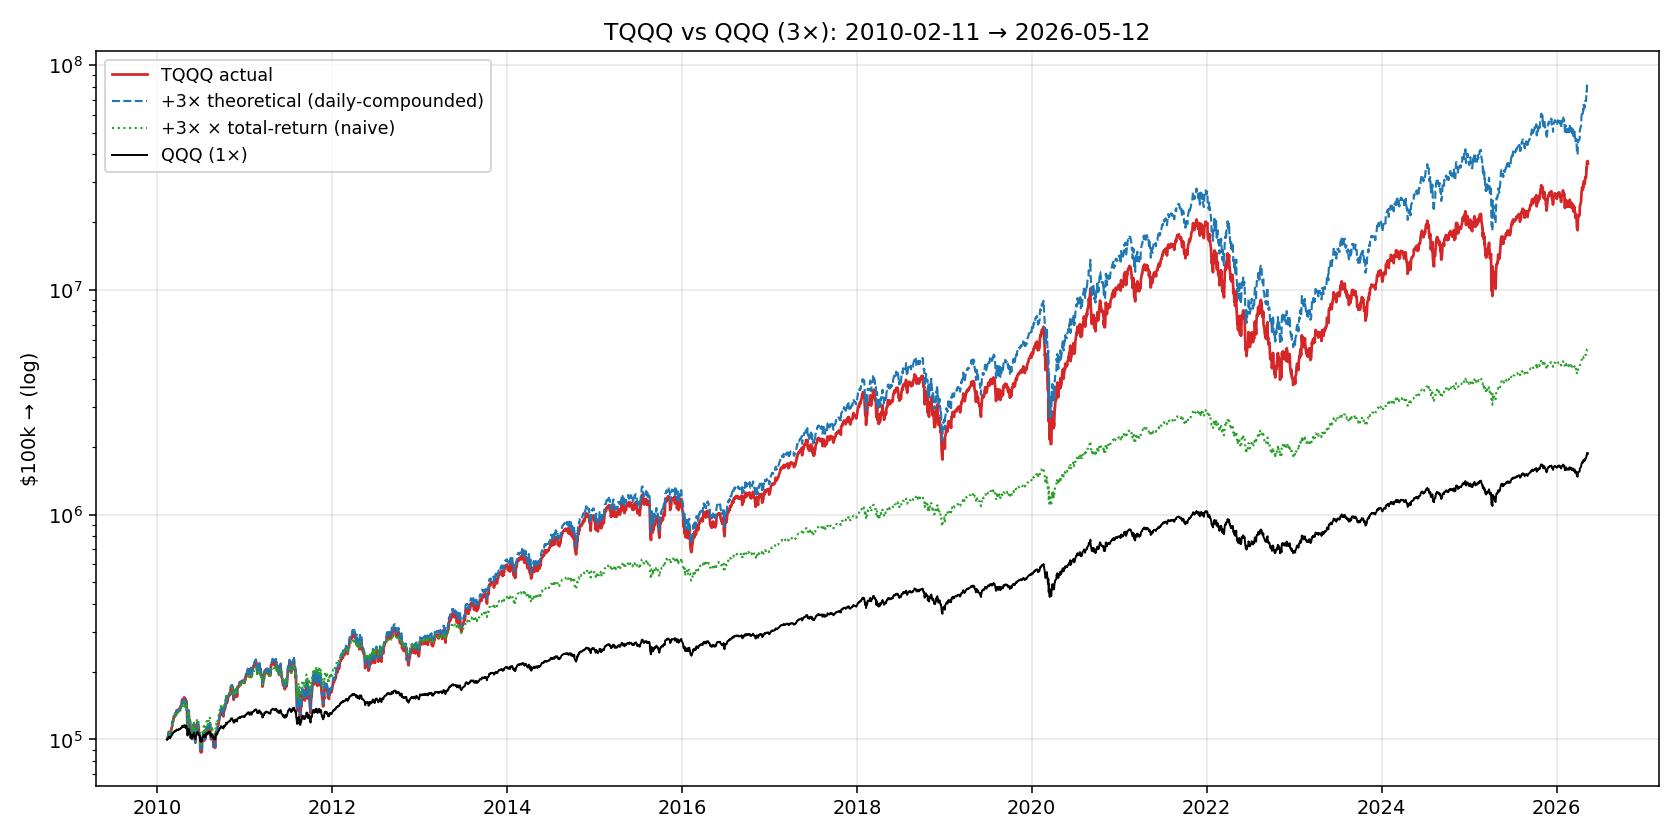
| TQQQ (ProShares UltraPro QQQ) | QQQ (Nasdaq-100) | +3× | 2010-02 | 0.84% | $25B |
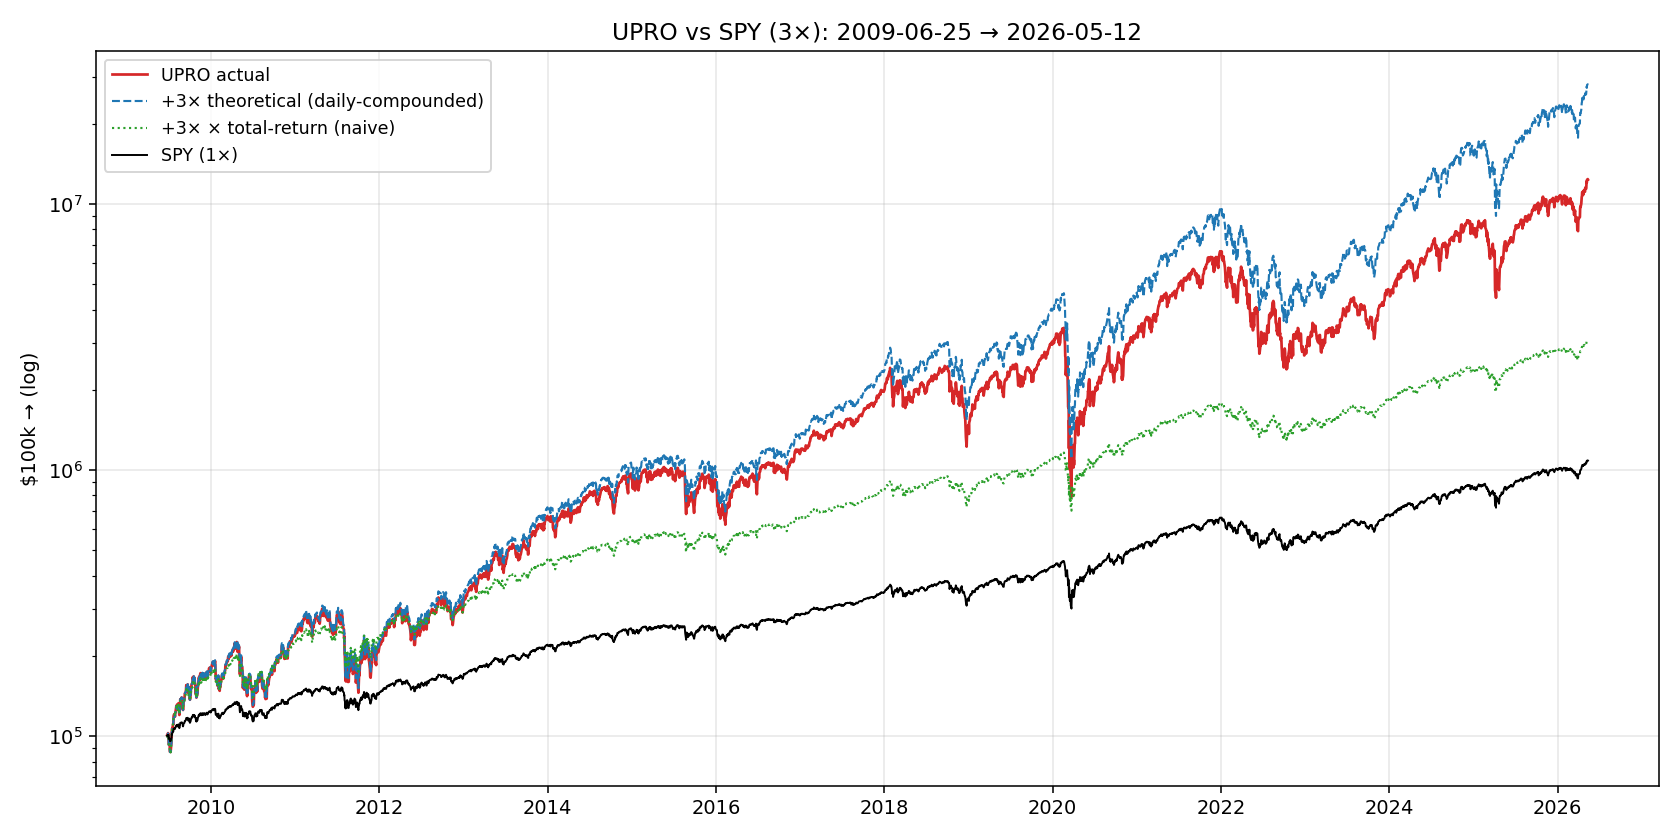
| UPRO (ProShares UltraPro S&P 500) | SPY (S&P 500) | +3× | 2009-06 | 0.91% | $4B |
| SSO (ProShares Ultra S&P 500) | SPY | +2× | 2006-06 | 0.91% | $5B |
| SQQQ (ProShares UltraPro Short QQQ) | QQQ | −3× | 2010-02 | 0.95% | $4B |
| SH (ProShares Short S&P 500) | SPY | −1× | 2006-06 | 0.88% | $1B |
ProShares 是这块市场的主导发行商。这五个是 retail 最熟的。还有 Direxion 的 SPXL/SPXS(3× SPY 多空对)、其他行业杠杆产品,但故事都是一样的。
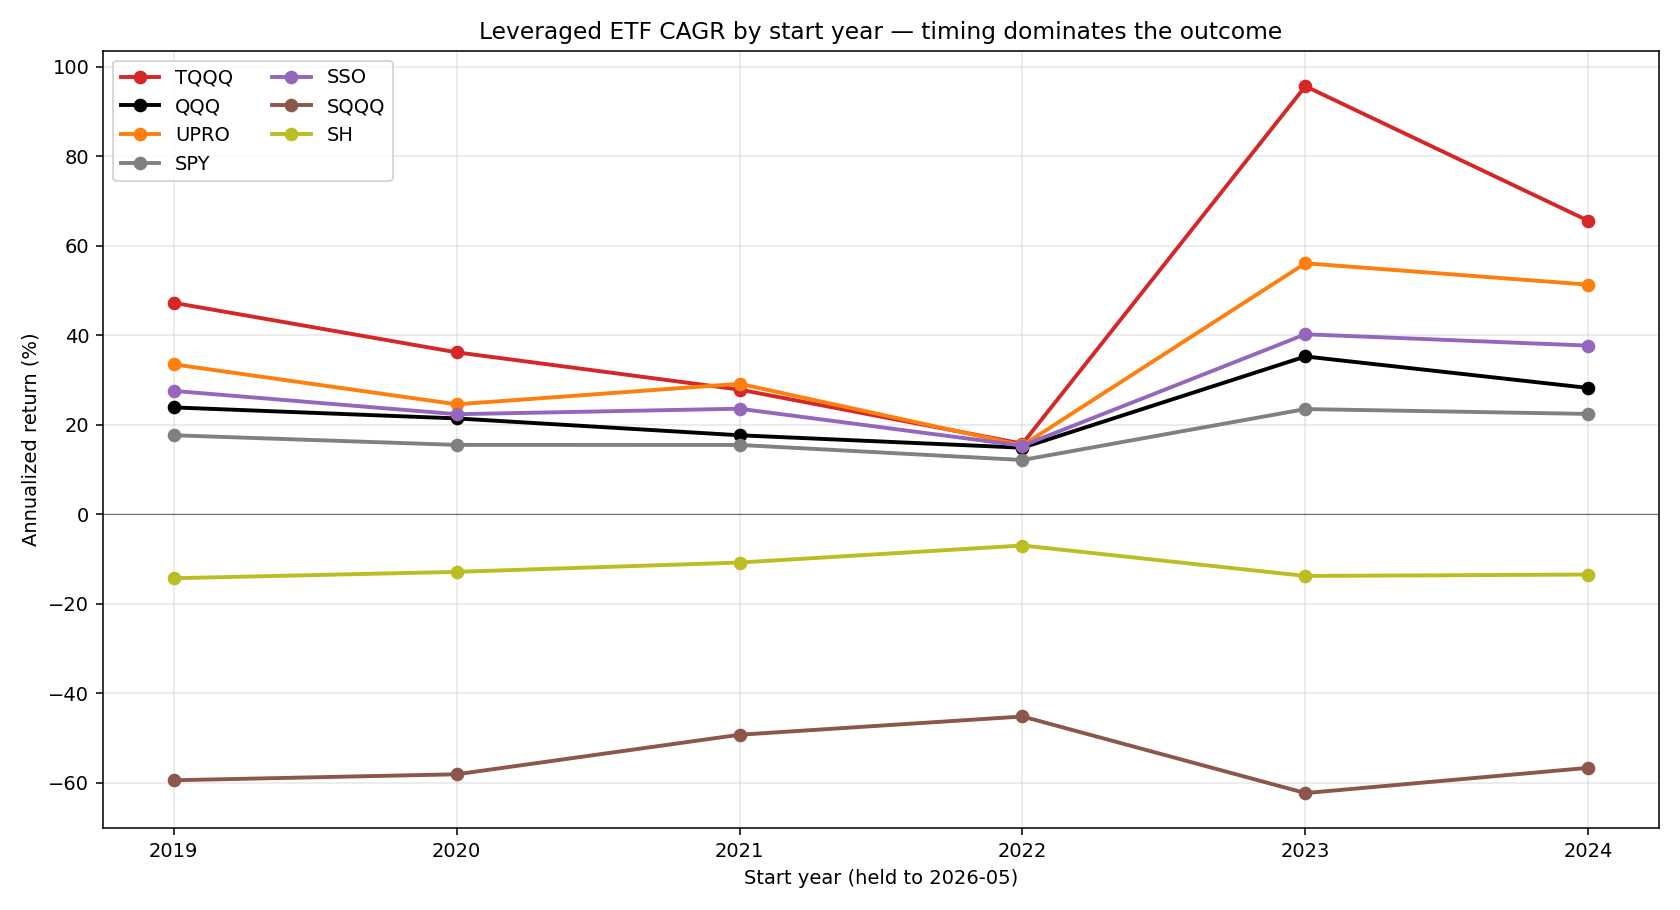
起始年份 dominate 一切——这张图
TQQQ 的红线是关键——根据你哪一年起步,CAGR 在 16% 到 96% 之间剧烈跳动。同期 QQQ 的黑线相对平稳(15-35%)。这两条线的差距告诉你 leverage 在做什么——在好时机放大收益,在坏时机被放大亏损。
更细的数字:
| 起始 | 持有 | TQQQ CAGR | TQQQ MaxDD | $100k → |
|---|---|---|---|---|
| 2019 | 7.4y | 47% | −82% | $1.72M |
| 2020 | 6.4y | 36% | −82% | $720k |
| 2021 | 5.4y | 28% | −82% | $370k |
| 2022 | 4.4y | 16% | −81% | $190k |
| 2023 | 3.4y | 96% | −58% | $952k |
| 2024 | 2.4y | 66% | −58% | $330k |
骇人的对比:2021 年 1 月 all in $100k 到今天是 $370k——账户翻 3.7 倍。代价是中途看着它跌到 $35k(−82%),然后被迫在那个位置等了一年多才回到本金。同样 $100k 放在 QQQ 是 $239k,没有那段地狱体验。
2023 年 1 月起步(也就是 2022 大跌之后开始)的人——$100k 到今天 $952k。一辈子最爽的一段。任何一个 2022 早期 buy the dip TQQQ 的人现在都是富翁。
这两个起点相差 24 个月。完全不同的 outcome。这就是“timing dominates”的意思。
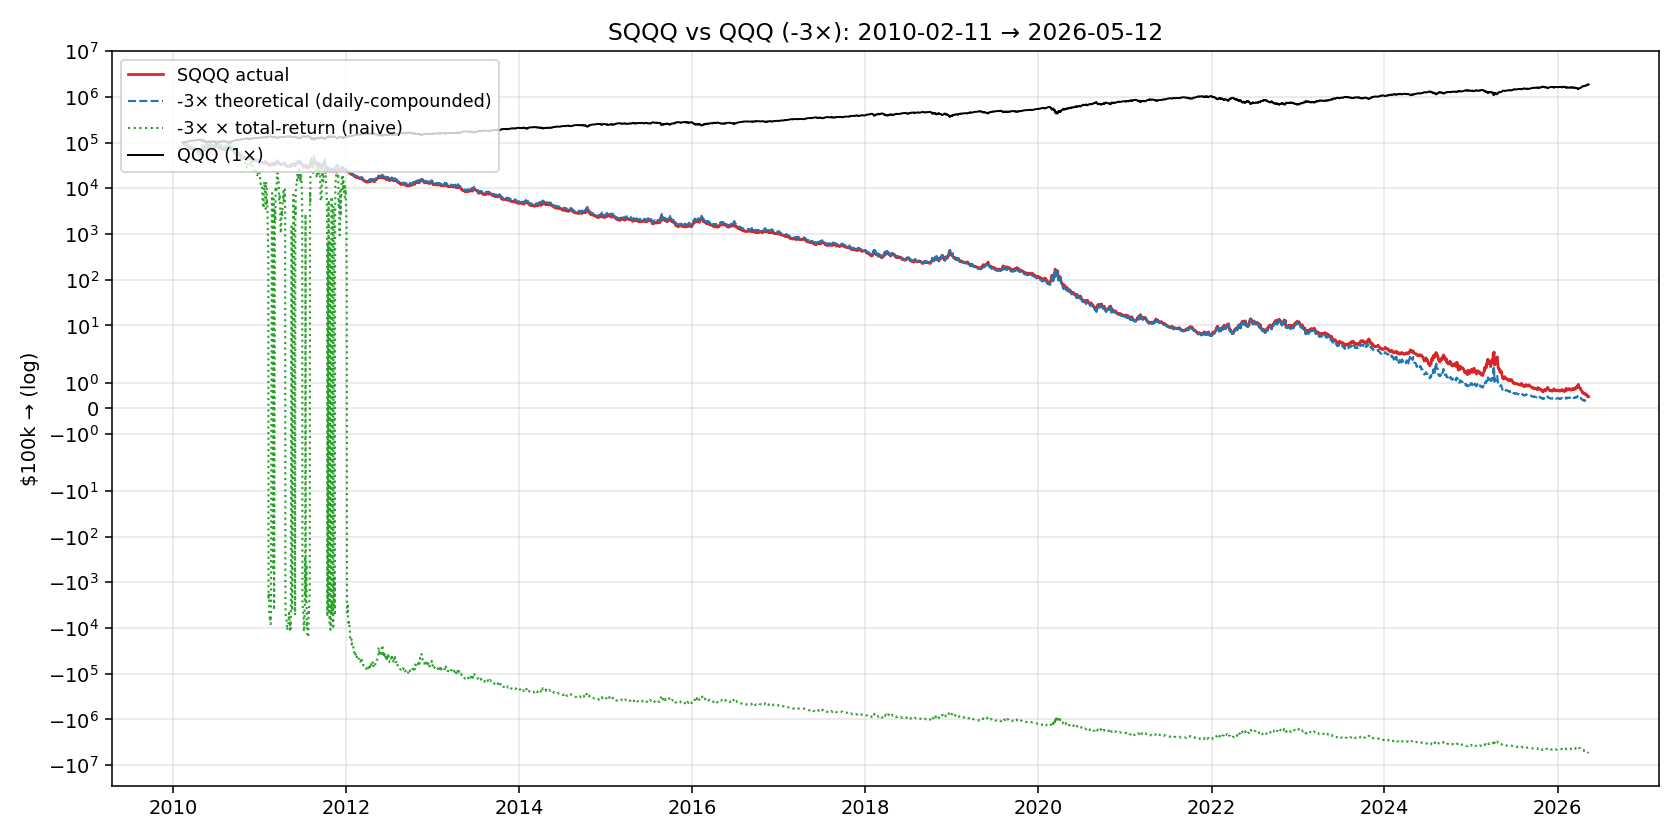
SQQQ 的死亡螺旋
反向 −3× 产品的故事完全不同。$100k 在 SQQQ 里:
| 起始 | 持有 | CAGR | 终值 |
|---|---|---|---|
| 2019 | 7.4y | −60% | <$1 |
| 2021 | 5.4y | −49% | $4 |
| 2022 | 4.4y | −45% | $13 |
| 2024 | 2.4y | −57% | $13 |
是的,真的是这些数字。$100,000 在每一个起始窗口都变成 $20 以下。即使你是 2022 起步——你以为 SQQQ 会在 2022 那个熊市里大赚——你的 $100k 也变成了 $13。为什么?因为在 2022 那场熊市真正发生之前,SQQQ 已经在 2020-2021 的牛市里被磨掉 95% 了。等终于“对了”,本金已经没剩多少。然后 2023-2024 的反弹把剩下的也消灭了。
过去 10 年的滚动窗口数据:100% 的 2 年期 SQQQ 窗口亏钱,100% 的 3 年期亏,100% 的 5 年期亏。不是 90%、不是 95%——是 100%。
SH (−1× SPY) 故事一样,只是亏得慢一点:起始 2019 年化 −14%,账户 $32k。100% 的 3 年期 SH 窗口亏钱。
不要把反向杠杆 ETF 当多月对冲工具。即使你方向对了它也漏血。对冲用 put option 或者短 SPY futures,不要用 SQQQ/SH。
全分布——滚动窗口看清楚
把 2010 年以来所有滚动窗口都列出来:
TQQQ 全分布
| 持有期 | 10th 分位 CAGR | 中位数 | 90th 分位 | 中位 MaxDD | 亏钱比例 |
|---|---|---|---|---|---|
| 1y | −10% | 53% | 119% | −37% | 18% |
| 3y | 7% | 46% | 66% | −58% | 4% |
| 5y | 20% | 40% | 63% | −70% | 0% |
仔细看 5y 那行:5 年中位回报 40% 看着很爽,但中位路径上最大回撤 70%——意味着 50% 的 5 年起点,你中途看着自己的钱跌过 70%。1y 行更刺激:1/5 的年份亏钱,最坏 10% 跌 10%。
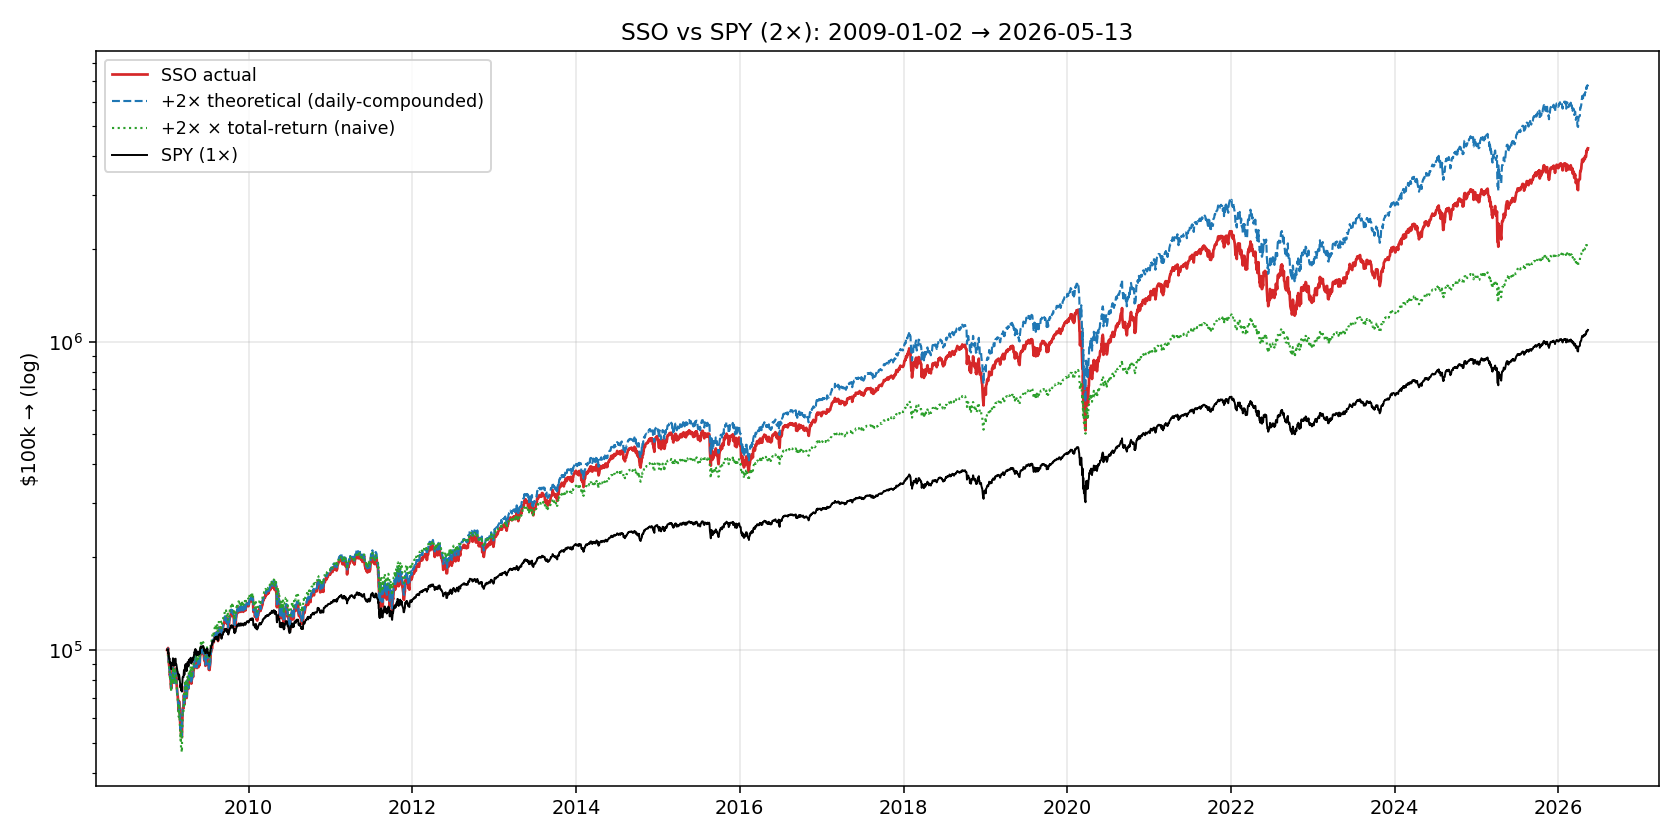
SSO 全分布(2× SPY,相对温和)
| 持有期 | 10th 分位 | 中位 | 90th 分位 | 中位 MaxDD |
|---|---|---|---|---|
| 1y | −6% | 26% | 60% | −21% |
| 3y | 12% | 21% | 35% | −36% |
| 5y | 14% | 22% | 29% | −47% |
SSO 在 5 年期里从没亏过,中位回撤 −47%——熊市级别,但生存得下来。比 TQQQ 的 −70% 友好得多。
1-5 年视角的实操建议
| 你的情况 | 合理做法 |
|---|---|
| 1 周到 6 个月战术看多 | 杠杆 ETF 没问题,drag 在短期可以忽略,行为接近 naive math。开仓、关仓、走人。 |
| 1-2 年看多 | LEAPS 通常优于 TQQQ(下面会讲),可以避开 daily-reset 风险。 |
| 3-5 年看多 | SSO 比 TQQQ 适合——2× 比 3× drag 少一半,drawdown 浅得多。 |
| Bear hedge 1-30 天 | 反向 ETF 可以用,短期 drag 小。 |
| 长期 bear hedge | 不要用反向杠杆 ETF。用 put options 或者短 futures。 |
| “Set and forget” 退休 | 不要。Drawdown 在 5 个产品里有 2 个达到 −80%,绝大多数 retail 扛不住。 |
替代方案 1:LEAPS
LEAPS = 长期股票 anticipation 证券。买一张 1-2 年到期的 SPY call。比如:
- SPY 现在 $580,买一张 $500 strike、2 年后到期的 call,付 $50/股 premium(delta 约 0.7)
- 你控制 $35k 的 SPY notional(100 × 0.7 × $500)
- 投入 $5,000(一张 contract 的 premium)
- Effective leverage 约 7×
- Premium decay(theta)一年 5-15%(取决于 moneyness)
跟 UPRO 比:UPRO 一年 drag 约 7%。LEAPS premium decay 一年 5-15%——成本相当。但有两个关键区别:
- LEAPS 是 path-independent 的:SPY 中间跌再涨回来,你照样赚(option 价格跟随)。UPRO daily reset,跌再涨损耗 vol drag。
- LEAPS 最大亏损是 premium($5k),不会爆仓。UPRO 没有“爆仓”概念,但也没有止损保护——会一直跟着标的走。
对1-2 年看多 view,LEAPS 通常胜出,因为可以扛中间的反复。对3+ 年持续上涨趋势,UPRO 的 compounding 帮你赚得更多。
替代方案 2:保证金贷款
最简单的杠杆方式——直接借钱买更多 SPY。
- IBKR margin rate 现在约 5-6%/年
- 你控制实际股票,没有 daily reset,没有 vol drag
- Margin call 在 −25% 到 −35%(broker-dependent)。你可能被强制平仓在最坏时刻
- Margin interest 可以从投资收入里扣税
跟 UPRO 比:5-6% margin cost vs UPRO 的 ~7% drag——margin 更便宜。但有 margin call 风险,UPRO 没有。
对有 portfolio margin(IBKR Pro)的成熟投资者:Margin 通常优于 UPRO。对大多数 retail:margin call 的尾部风险比 UPRO 的结构性 drag 更糟。
替代方案 3:Futures(MES、MNQ)
E-mini futures 的“micro”版本——MES (S&P 500 micro)、MNQ (Nasdaq micro):
- 1 张 MES = $5 × ES 指数 = 现在大约 $30k notional
- 保证金大约 $1,500-2,000/张
- Effective leverage 15-20×
- 没有 daily reset,没有 expense ratio,但要每季度 roll contract
- 60/40 LTCG/STCG 拆分(不管持多久)—比 UPRO 的 STCG 分红友好
最高效但最专业的杠杆方式。需要懂 contract specs、roll mechanics、margin 管理。对懂的人是最便宜的杠杆,对不懂的人可能很快爆仓。
税务上 leveraged ETF 的坑
杠杆 ETF 因为每日 rebalance,turnover 极高,每年分发大量 STCG:
| 账户类型 | TQQQ 税后有效 CAGR |
|---|---|
| Roth IRA | 全部税前(~44%) |
| Traditional IRA | 延税(~44% gross) |
| Taxable, 35% bracket | 30-35% |
| Taxable, top bracket + 州税 | 25-30% |
在加州 top bracket 的 taxable 账户里,头部收益要扣掉三分之一去交税。杠杆 ETF 优先放税务优惠账户。
Stop-loss 这件事
那个“$100k 在 TQQQ 里到 2026 变成 $1.72M”的人——实际上不存在。每个真正持仓的人在 2022 那段 −82% 的时候,账户从 2021 年 11 月的 ~$900k 峰值跌到 2022 年底的 ~$170k 的时候,几乎都卖了。能扛过去的是少数。
两个值得考虑的规则止损:
- −30% drawdown 止损:2022 那次会在 −30% 出场,避开后面的暴跌。错过 2023 的反弹一部分。risk-adjusted return 更好,心理压力大大减小。
- −50% drawdown 止损:覆盖最坏情况,对中等回撤保留参与。
原则:进场之前定好出场规则。drawdown 中间临时想规则永远不会执行得好。
“TQQQ 当退休账户” 的神话
TikTok / WSB 上的经典宣传:“30 岁 all in $100k TQQQ,65 岁退休拿 $5000 万。” 数学上算 TQQQ 平均年化 44%,35 年复利确实是这个数量级。
数学没考虑三件事:
1. 没人能 35 年不卖。2018 圣诞、2020 新冠、2022 加息——每一次都是足够把绝大多数持有者洗出去的级别。17 倍的财富倍数要求你在 −82% drawdown 中不卖。统计上几乎没有人做得到。
2. Survivorship bias。2010 年存在的 3× 杠杆 ETF 还活着的就这几个。Direxion 的某些 sector 3× 产品、VelocityShares 的一整条线——blow up、关停、reverse split 到死。提前知道哪个能活下来是非凡 hindsight。
3. Regime dependence。2010-2026 是美股历史最长的牛市。1968-1984 滞胀环境、2000-2016 含两次崩盘——在那些 16 年窗口里 3× 产品大概率是负的 CAGR。你不知道下一个 16 年是哪种 regime。
Retail 的神话假设下一个 10 年完全等于过去 10 年。可能是,大概率不是。
我会怎么操作
按你的目标:
- 1 周到 6 个月看多:杠杆 ETF OK,drag 短期可忽略,行为贴近 math。
- 1-2 年看多:LEAPS 比 TQQQ/UPRO 通常更优,path-independent。
- 3-5 年看多:SSO 是合适层级,2× 加 3.5%/yr drag,3× 加 7%/yr drag——SSO 是 sweet spot。
- 5+ 年牛市看多 + 高心理承受力:UPRO 或 TQQQ 可以,但 sizing 要小(≤20% 整体仓位)。
- 税务优惠账户优先:STCG 分红在 taxable 里吃掉 1/3 的回报。
- 预设 stop loss:−30% 或 −50% drawdown 出场。提前写下来。
- 永远不要长期持有反向杠杆 ETF。即使方向对了也漏血。
- 每年重新评估 regime。如果你觉得下个 10 年更像 2000-2009 而不是 2010-2026,scale back。
一些技术细节
- 样本只有一段牛市(2009-2026)。把 2000-2009 含进去会让 5 年期 TQQQ 分布出现大额负回报。我们没有 2009 之前的杠杆 ETF 历史。
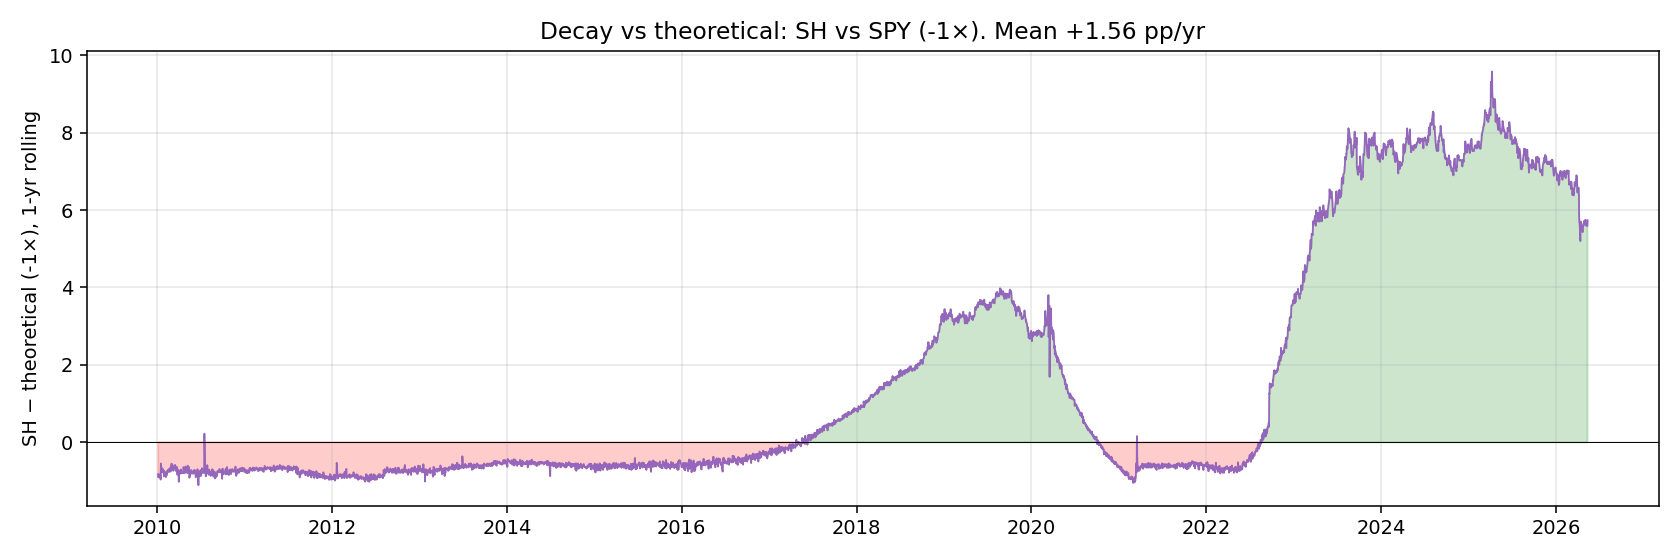
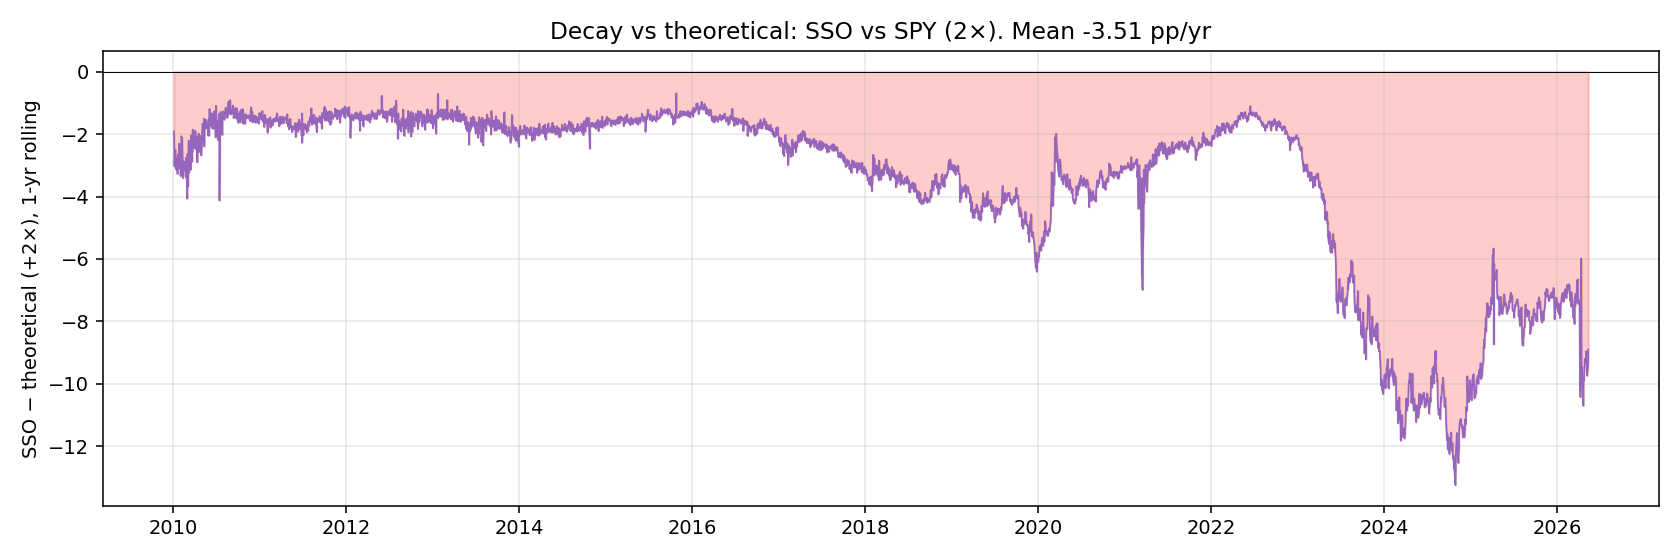
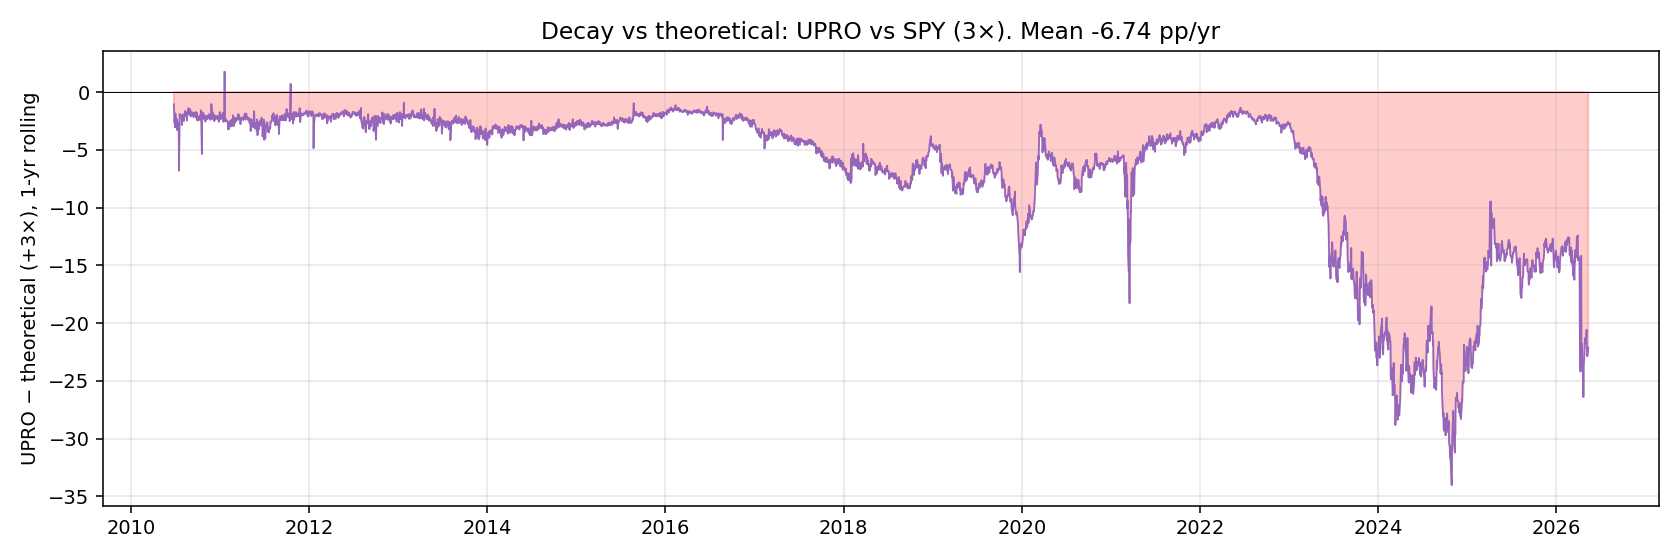
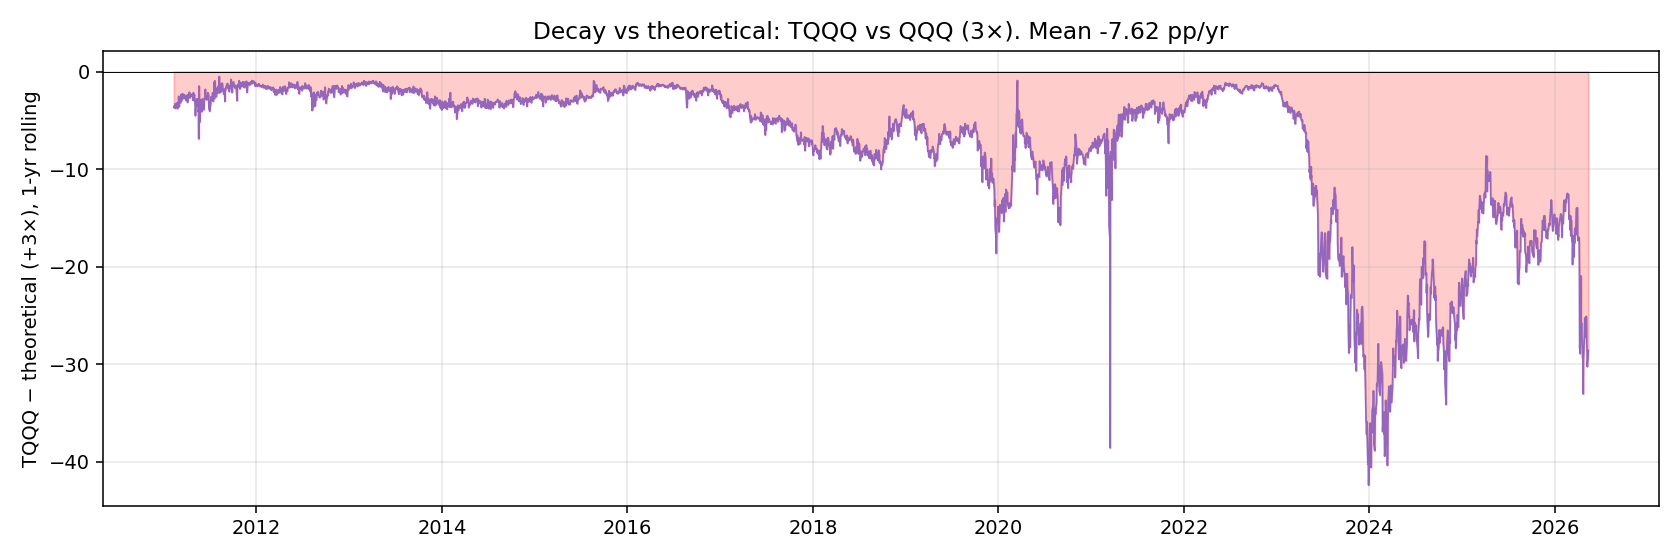
- 理论曲线不含 expense ratio。TQQQ 的 0.84%/yr 是 7pp/yr drag 中的一部分,大头是 daily compounding loss + 融资成本,不是显性 fee。
- 没考虑 dividend。两侧都用 adjusted close,对比是公平的,但底层 ETF 持有者有 dividend 收益,杠杆 ETF 持有者没有(swap 复制的是 price-only return + funding)。
- Equity curve 不含税。Taxable 账户里 STCG 分发明显改变实际 CAGR。
- 没显示 tracking error volatility。实际 ETF 每天会偏离目标几个 bps,5 年里也会复利。
文件
experiments/exp_36_leveraged_etf_decay.py-
summary.csv— 全周期 CAGR / Sharpe / MaxDD per curve -
breakeven.csv— per-horizon win-rate matrix -
windowed_perf.csv— rolling 1-5y 分布 -
recent_starts.csv— 起始 2019-2024 各窗口 -
plots/equity_*.png— equity 曲线 per pair -
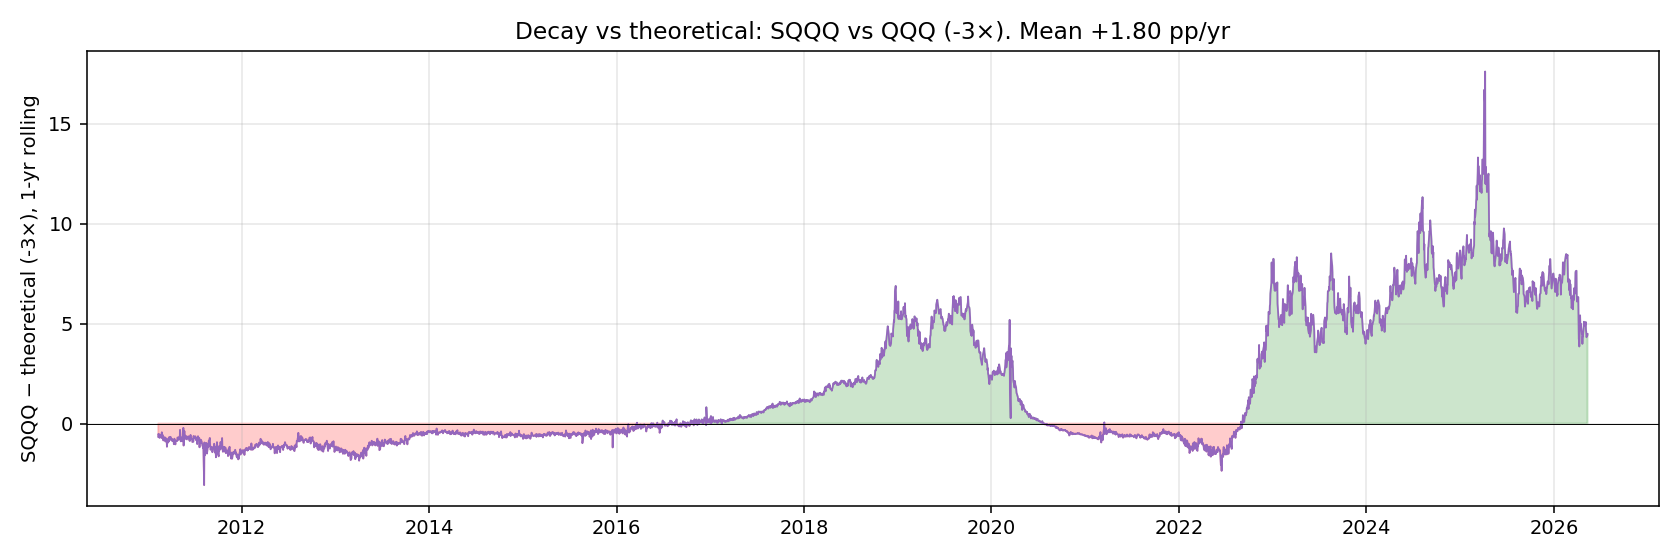
plots/decay_*.png— rolling 1y decay timelines -
plots/breakeven_heatmap.png— % of N-year windows leveraged 跑赢 benchmark -
plots/cagr_by_start_year.png— 起始年份决定一切
English
TQQQ (a 3× leveraged Nasdaq-100 ETF — when the underlying index moves 1% it moves 3% in the same direction) is one of the most-pitched leveraged products on retail forums — “Nasdaq goes up long-term, so 3× leverage is just 3× the return” gets repeated every few months. Something about it always felt off without being able to pin down exactly what, so I pulled every day of data since 2010 and ran the numbers.
The first result was sharper than I expected. Someone who all-in’d TQQQ in January 2024 has earned 66 % a year through today; someone who all-in’d in January 2021 has earned 28 % a year, but watched their account drop 82 % along the way. Same product, two starts three years apart, two completely different lived experiences.
Leveraged ETFs over 1-5 year horizons are timing-dominated. Median returns are extraordinary; median drawdowns are also extraordinary — TQQQ’s median maximum drawdown across any 5-year rolling window is −70 %. If you can’t sit through a 70 % loss, this product isn’t for you regardless of the headline CAGR.
The story for the inverse products (SQQQ, SH) is simpler: across every rolling 3+ year window in the last decade, they lost money. 100 % of 3-year windows, 100 % of 5-year windows — losses.
The short version
| Started | Years | TQQQ | QQQ | UPRO | SPY | SSO | SQQQ |
|---|---|---|---|---|---|---|---|
| 2019 | 7.4 | 47 % | 24 % | 33 % | 18 % | 28 % | −60 % |
| 2021 | 5.4 | 28 % | 18 % | 29 % | 15 % | 24 % | −49 % |
| 2022 | 4.4 | 16 % | 15 % | 15 % | 12 % | 15 % | −45 % |
| 2024 | 2.4 | 66 % | 28 % | 51 % | 22 % | 38 % | −57 % |
(SH is similar to SQQQ — all CAGRs negative, ranging −7 % to −14 %.)
The key signal: TQQQ from 2024 = 66 % CAGR. But TQQQ from 2021 = 28 % — earned only after surviving an 82 % drawdown along the way. Timing is the core variable, not the leverage multiple.
How a leveraged ETF actually works
Three things retail traders consistently get wrong:
1. It targets a daily multiple, not a long-run one. TQQQ aims to return 3× whatever QQQ returns today. At market close it rebalances; tomorrow starts fresh. “QQQ went up 20 % this year” does not imply TQQQ went up 60 %.
2. It uses derivatives (mostly total return swaps), not direct leveraged stock holdings. TQQQ doesn’t borrow $200 to buy $300 of QQQ. It signs swap contracts where banks pay it 3× QQQ’s daily return in exchange for a financing fee (currently ~5-6 %/year). That financing cost is a real annual drag.
3. Compounding is multiplicative. If QQQ does +1 %, −1 %, +1 %, −1 % over four days, it ends roughly flat. TQQQ over the same four days does +3 %, −3 %, +3 %, −3 % and ends down 0.36 % — because (1.03 × 0.97)² < 1. That’s vol drag, amplified at 3× leverage.
4. The other direction: if QQQ rises a smooth 0.5 % every day for 20 days with no down days, TQQQ doesn’t end at +30 % (3 × 10 %) but at about +34 % — daily compounding’s positive convexity. Smooth uptrends, leverage helps. Choppy markets, leverage hurts.
Which regime dominates determines your outcome.
The four products explained
| Ticker | Underlying | Multiple | Launched | Expense | AUM |
|---|---|---|---|---|---|
| TQQQ (ProShares UltraPro QQQ) | QQQ (Nasdaq-100) | +3× | Feb 2010 | 0.84 % | $25 B |
| UPRO (ProShares UltraPro S&P 500) | SPY | +3× | Jun 2009 | 0.91 % | $4 B |
| SSO (ProShares Ultra S&P 500) | SPY | +2× | Jun 2006 | 0.91 % | $5 B |
| SQQQ (ProShares UltraPro Short QQQ) | QQQ | −3× | Feb 2010 | 0.95 % | $4 B |
| SH (ProShares Short S&P 500) | SPY | −1× | Jun 2006 | 0.88 % | $1 B |
ProShares is the dominant issuer in this space. These five are the ones retail mostly knows. There’s also Direxion’s SPXL/SPXS (3× SPY long/short pair) and various sector-specific leveraged products, but the story is the same.
The start year dominates everything
TQQQ’s red line is the key — your CAGR swings between 16 % and 96 % depending on which year you started. QQQ’s black line is more stable (15-35 %). The gap tells you what leverage does — amplifies returns at good times, amplifies losses at bad ones.
The detail:
| Started | Years | TQQQ CAGR | TQQQ MaxDD | $100k → |
|---|---|---|---|---|
| 2019 | 7.4 | 47 % | −82 % | $1.72 M |
| 2020 | 6.4 | 36 % | −82 % | $720 k |
| 2021 | 5.4 | 28 % | −82 % | $370 k |
| 2022 | 4.4 | 16 % | −81 % | $190 k |
| 2023 | 3.4 | 96 % | −58 % | $952 k |
| 2024 | 2.4 | 66 % | −58 % | $330 k |
The jarring contrast: all-in $100 k in TQQQ from January 2021 is $370 k today — a 3.7× return. The cost was watching it drop to $35 k along the way (−82 %) and being stuck there for over a year before recovering. The same $100 k in plain QQQ became $239 k without the hellish path.
Someone who started in January 2023 (right after the 2022 bottom) — $100 k became $952 k. The dream window. Any TQQQ-buyer who hit the dip in early 2022 is rich.
These two start dates are 24 months apart. Completely different outcomes. That’s what “timing dominates” means.
SQQQ’s death spiral
The inverse −3× story is completely different. $100 k in SQQQ:
| Started | Years | CAGR | Final |
|---|---|---|---|
| 2019 | 7.4 | −60 % | <$1 |
| 2021 | 5.4 | −49 % | $4 |
| 2022 | 4.4 | −45 % | $13 |
| 2024 | 2.4 | −57 % | $13 |
Yes those are the real numbers. $100 000 became under $20 in every recent window. Even someone who started in 2022 — you’d think a bear-side product would have shined in the 2022 bear — turned $100 k into $13. Why? Because by the time the 2022 bear actually happened, SQQQ had already been ground down 95 % by the preceding bull. Once the strategy finally “worked,” there was barely any principal left. Then 2023-2024‘s recovery finished it off.
Rolling-window data: 100 % of 2-year, 3-year, and 5-year SQQQ windows ended negative in the last decade. Not 90 %. Not 95 %. Every single one.
SH (−1× SPY) is the same story slower: starting 2019, CAGR −14 %, $32 k final. 100 % of 3-year SH windows ended negative.
Do not hold inverse leveraged ETFs as a multi-month hedge. They bleed even when you’re directionally right. Use put options or short futures for hedging, not SQQQ/SH.
Full distributions across rolling windows
Pooling all rolling windows since 2010:
TQQQ full distribution
| Horizon | 10th-pct CAGR | Median | 90th-pct | Median MaxDD | Frac negative |
|---|---|---|---|---|---|
| 1y | −10 % | 53 % | 119 % | −37 % | 18 % |
| 3y | 7 % | 46 % | 66 % | −58 % | 4 % |
| 5y | 20 % | 40 % | 63 % | −70 % | 0 % |
Read the 5y row carefully: a 5-year median CAGR of 40 % looks great, but the median worst drawdown along the way is 70 % — meaning half of all 5-year starts watched their account drop more than 70 % at some point. The 1y row is wilder: 1 in 5 years is negative; the worst 10 % drops 10 %.
SSO full distribution (2× SPY, more modest)
| Horizon | 10th-pct | Median | 90th-pct | Median MaxDD |
|---|---|---|---|---|
| 1y | −6 % | 26 % | 60 % | −21 % |
| 3y | 12 % | 21 % | 35 % | −36 % |
| 5y | 14 % | 22 % | 29 % | −47 % |
SSO never lost over 5 years in our data and the median 5-year MaxDD was −47 %. That’s bear-market-bad but survivable in a way −70 % isn’t.
1-5 year practical guidance
| Your scenario | Right call |
|---|---|
| 1-week to 6-month tactical bull | Leveraged ETFs fine, drag is small at short horizons, behavior tracks naive math. Open, close, exit. |
| 1-2 year bull view | LEAPS usually beat TQQQ (below), avoids daily-reset risk. |
| 3-5 year bull view | SSO is the right level — 2× has half the drag of 3×, much shallower drawdowns. |
| 1-30 day bear hedge | Inverse ETFs OK — drag is small at short horizons. |
| Long-term bear hedge | Don’t use inverse leveraged ETFs. Use puts or short futures. |
| “Set and forget” retirement | No. Drawdowns reach −80 % in 2 of 5 products. Most retail won’t sit through that. |
Alternative 1: LEAPS
LEAPS (Long-term Equity AnticiPation Securities) — buy a 1-2 year SPY call. For example:
- SPY at $580, buy a $500 strike call expiring in 2 years for $50/share premium (delta ~0.7)
- You control $35 k of SPY notional (100 × 0.7 × $500)
- Capital invested: $5 000 (one contract’s premium)
- Effective leverage ~7×
- Premium decay (theta) 5-15 % a year (moneyness-dependent)
vs UPRO: UPRO drag is ~7 % a year. LEAPS premium decay is 5-15 % a year — roughly equivalent cost. Two key differences:
- LEAPS are path-independent. If SPY crashes and recovers, you still profit (the option follows). UPRO daily-resets and loses vol drag to the round trip.
- LEAPS max loss is the premium ($5 k), no margin call. UPRO has no “margin call” concept but also no built-in stop — it just rides the underlying down.
For 1-2 year bullish views, LEAPS usually win because they survive mid-period chop. For 3+ year sustained uptrends, UPRO’s compounding catches up and exceeds.
Alternative 2: margin loans
Simplest leverage approach — borrow money to buy more SPY directly:
- IBKR margin rate is ~5-6 %/year right now
- You control actual shares, no daily reset, no vol drag
- Margin calls trigger at −25 % to −35 % (broker-dependent). You can be force-sold at the worst possible moment.
- Margin interest is deductible against investment income
vs UPRO’s ~7 %/year drag, 5-6 % margin cost is cheaper, but margin-call risk is real (UPRO has no margin call but no protection either).
For sophisticated investors with portfolio margin (IBKR Pro): margin usually beats UPRO. For most retail: margin’s tail risk is worse than UPRO’s structural drag.
Alternative 3: futures (MES, MNQ)
The “micro” sizes of E-mini futures — MES (S&P 500 micro), MNQ (Nasdaq micro):
- 1 MES = $5 × ES index ≈ $30 k notional right now
- Margin requirement ~$1,500-2,000 per contract
- Effective leverage 15-20×
- No daily reset, no expense ratio, but quarterly contract roll required
- 60/40 LTCG/STCG split regardless of holding period (futures tax rule) — friendlier than UPRO’s STCG distributions
Most efficient but most professional leverage. Requires understanding contract specs, roll mechanics, margin management. Cheapest leverage for those who understand it, blow-up risk for those who don’t.
Tax issues for leveraged ETFs
Leveraged ETFs distribute capital gains aggressively because of daily rebalancing turnover:
| Account type | TQQQ effective after-tax CAGR |
|---|---|
| Roth IRA | full pre-tax (~44 %) |
| Traditional IRA | deferred (~44 % gross) |
| Taxable, 35 % bracket | 30-35 % |
| Taxable, top bracket + state | 25-30 % |
A California top-bracket taxable account loses about a third of headline returns to STCG distributions. Hold these in tax-advantaged accounts whenever possible.
The stop-loss conversation
The person who actually compounded $100 k → $1.72 M in TQQQ since 2019 mostly doesn’t exist. By Q4 2022, with the account down 82 % from the November 2021 peak — from ~$900 k to ~$170 k — almost everyone sold. Sitting through that is the exception, not the norm.
Two rule-based exits worth considering:
- −30 % drawdown stop. The 2022 crash would have exited at −30 % instead of −82 %. Misses some of the 2023 recovery, but the risk-adjusted return is much better and the psychological cost is dramatically lower.
- −50 % drawdown stop. Covers worst-case events without triggering on mild corrections.
Principle: define your exit rule before you put on the trade. Decisions made during drawdown rarely execute well.
The “TQQQ as a retirement vehicle” myth
TikTok and WSB sell this story constantly: “30 years old, all-in $100 k TQQQ, retire at 65 with $50 million.” The arithmetic works — TQQQ averaged 44 % CAGR over 16 years, 35 years of compounding gets you absurd numbers.
The arithmetic ignores three things:
1. Nobody can hold for 35 years without selling. Dec 2018, Mar 2020, the 2022 hiking cycle — every one of those was severe enough to flush most holders. The 17× wealth multiple requires not selling through −82 % drawdowns. Statistically almost nobody does.
2. Survivorship bias. Other 3× ETFs that existed in 2010 — Direxion sector products, the entire VelocityShares lineup — blew up, closed, or reverse-split into oblivion. Picking the survivor in advance is non-trivial.
3. Regime dependence. 2010-2026 was the longest US bull on record. A different 16-year window (1968-1984 stagflation, 2000-2016 with two crashes) would have produced negative CAGR even at 3×. You don’t know which regime you’re getting.
The retail myth assumes the next decade looks identical to the last. It might. It probably doesn’t.
What I would actually do
By goal:
- 1-week to 6-month bull view: leveraged ETFs OK, drag negligible short-term.
- 1-2 year bull view: LEAPS usually beat TQQQ/UPRO — path-independent.
- 3-5 year bull view: SSO is the right level — 2× costs ~3.5 %/yr in drag, 3× costs ~7 %/yr. SSO is the sweet spot.
- 5+ year bull view with high pain tolerance: UPRO/TQQQ OK but size small (≤20 % of portfolio).
- Use tax-advantaged accounts first. STCG distributions eat a third in taxable accounts.
- Pre-commit to stop loss. −30 % or −50 % drawdown exit. Write it down.
- Never hold inverse leveraged ETFs long-term. They bleed even when you’re right.
- Reassess regime annually. If the next 10 years look more like 2000-2009 than 2010-2026, scale back.
Boring stuff
- The sample is one bull market (2009-2026). Including 2000-2009 would have produced large negative entries in the 5-year TQQQ distribution. We don’t have pre-2009 leveraged ETF history.
- Theoretical curves exclude expense ratios. TQQQ’s 0.84 %/yr fee is part of the 7 pp/yr drag, most of which is daily-compounding loss + financing cost, not the explicit fee.
- No dividend handling. Both leveraged and benchmark use adjusted close, so the comparison is fair, but the underlying ETF holders earned dividends along the way that leveraged holders didn’t (swaps replicate price-only return + funding).
- Equity curves are pre-tax. Material to taxable holders.
- Tracking-error volatility not shown. The actual ETF can deviate from its target by a few bps daily — compounds over 5 years.
Files
experiments/exp_36_leveraged_etf_decay.py-
summary.csv— CAGR / Sharpe / MaxDD per curve over full history. -
breakeven.csv— per-horizon win-rate matrix. -
windowed_perf.csv— rolling 1-5y window CAGR / MaxDD distributions. -
recent_starts.csv— what someone starting in 2019-2024 would have earned. -
plots/equity_*.png— equity curves per pair. -
plots/decay_*.png— rolling 1y decay timelines. -
plots/breakeven_heatmap.png— % of N-year windows leveraged beats benchmark. -
plots/cagr_by_start_year.png— start year dominates outcome.