QUANT · APRIL 2026
SPY 上写 covered call 到底赚不赚钱
Are covered calls actually paying you?
中文
上个月吃饭聊到一个朋友——他从 2019 年开始一直在 SPY(S&P 500 指数 ETF)上写 covered call(持股的同时卖出一个 call 期权,把“股价涨过某个 strike 之后”的所有上涨封顶,换 premium 现金),每个月一套:挑一个 OTM 3% 的 strike(OTM = out-of-the-money,strike 比现价高 3%),把 call 卖掉,收 5-10 美元/股的 premium(期权买方付给卖方的钱),等到月底 expire。大多数月份合约归零,premium 揣兜里;有几个月 SPY 涨太凶,他得按 strike 把股票交出去,让出一截 upside。
他纠结的是最朴素的那个问题:这事到底是在挣钱,还是源源不断把 upside 送给 long call 的那群人?复盘了几年也不太会算“如果当时没写、纯持 SPY 是什么样”这条对照线——而这条对照线才是关键。
回去把 33 年的数据全跑了一遍。比预期差,又比预期好——看你到底想干啥。
短答
2019 年 1 月买 SPY 一直拿到现在,CAGR 大概 17%。同一个人改成每月写 3% OTM covered call,CAGR 大概 13%。每年差 4 个点。20 万本金算下来,相当于一年让出 8000 块收益。这不是小钱。也绝不是网上说的“白送的 income”。
但这么算是错的。covered call 在出事的时候,MaxDD 只有 −12%,而纯 SPY 是 −34%(2020 年 3 月那次)。2022 年末、2025 年初差距也类似。Sharpe 也更好——大约 1.0 比 0.83。这个策略干的事跟说的完全一致:拿 upside cap 换 drawdown 平滑度。问题是,“drawdown 平滑”是个跟“赚更多钱”完全不同的产品。很多写 covered call 的人没搞清楚自己其实是在买哪个。
一段话讲机制
你手里有 100 股 SPY。你把“30 天后以高出现价 3% 的价格买走这 100 股”的权利卖给别人,他付你 7 美元/股的 premium。如果到期 SPY 没到 strike,合约归零,股票和现金都归你。如果 SPY 涨穿了 strike,对方按 strike 拿走股票,你让出 3% 以上的所有 upside,但 premium 还是你的。Premium 永远归你,代价是 upside 被 cap 住。这就是全部产品。
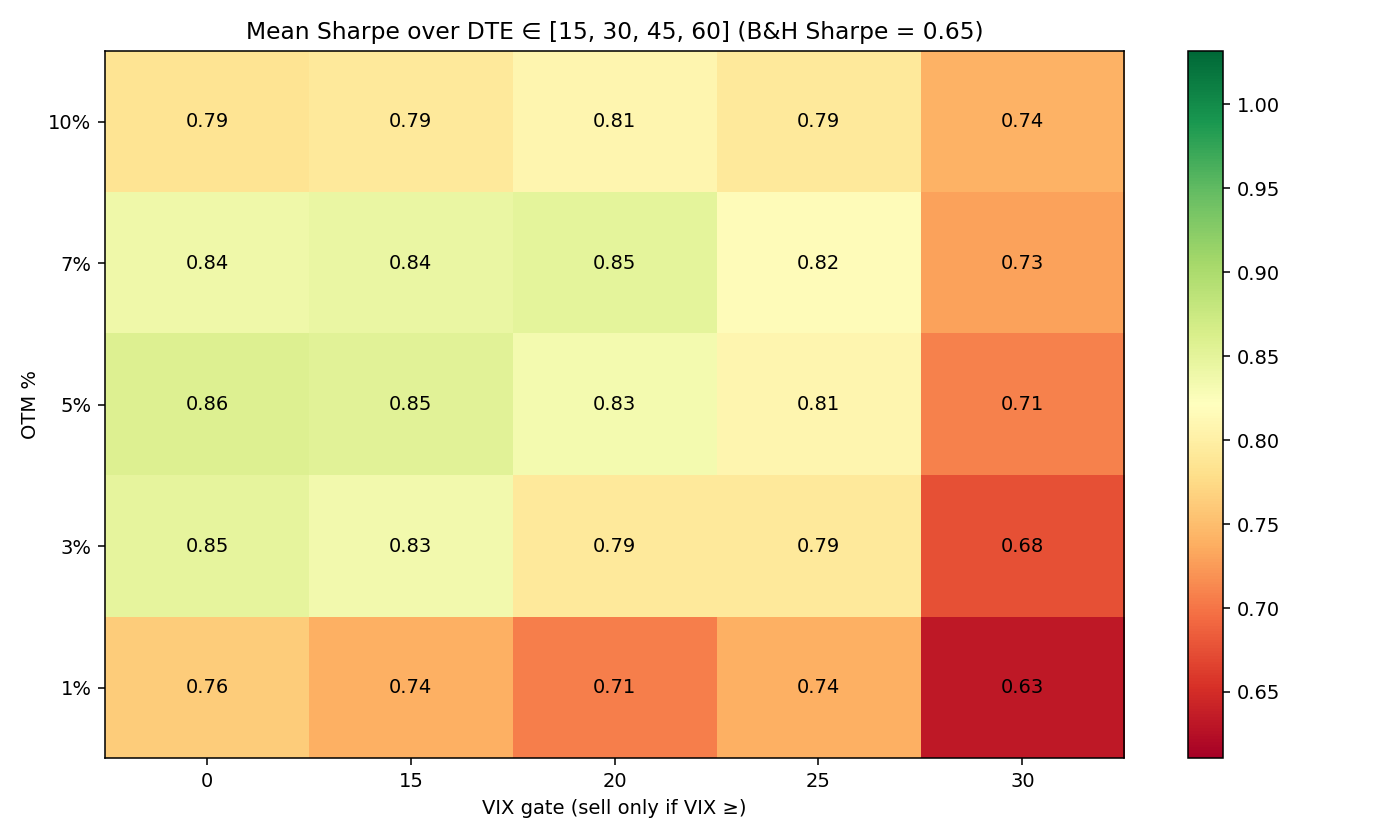
(还有更花哨的版本,比如“只在 VIX 高于 20 时才卖”。我们也测了,没用。后面会说。)
我们测了啥
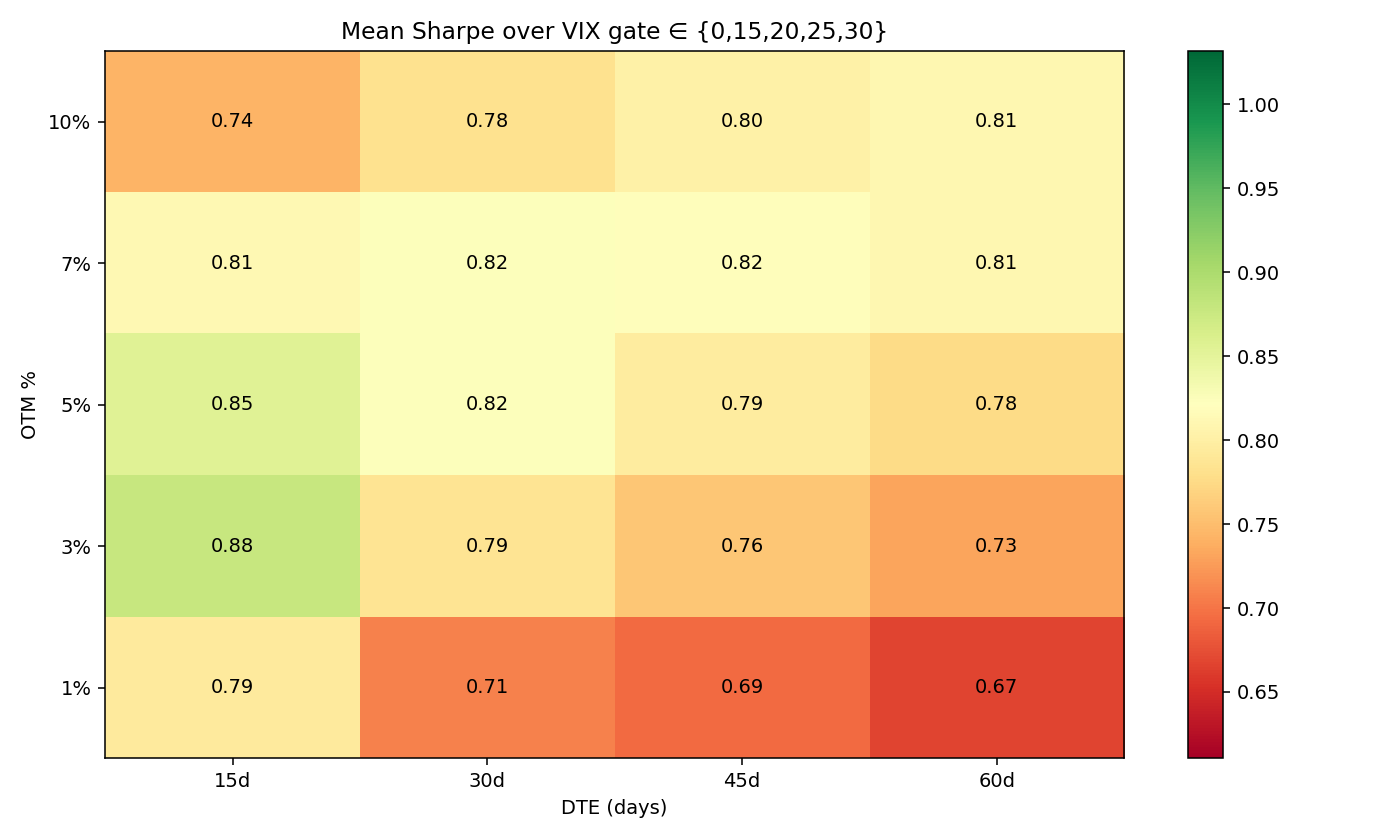
Backtest 把每种组合都跑了一遍:strike 位置(1 / 3 / 5 / 7 / 10% OTM)、DTE(15 / 30 / 45 / 60 天)、是否按 VIX 择时(一直写,或只在 VIX > 15 / 20 / 25 / 30 时写)。一共 100 种配置,1993 年 1 月到 2026 年 5 月,33 年 SPY 历史——覆盖了科技泡沫、08 金融危机、新冠、22 加息周期。Premium 用 Black-Scholes 公式算,VIX 当 implied vol 喂进去——对 SPY 来说跟市场真实成交 mid 误差 10% 以内,可以接受。(这套方法只对 SPY、QQQ 这种宽基 index 有效。放到 NVDA、TSLA 那种单股 option 上是错得离谱的——单股的 IV 比 VIX 高 2-3 倍,B-S+VIX 估出来的 premium 比真实价低 5-15 倍。要做单股 option 必须用单股自己的 IV 或者真实 market quote。)
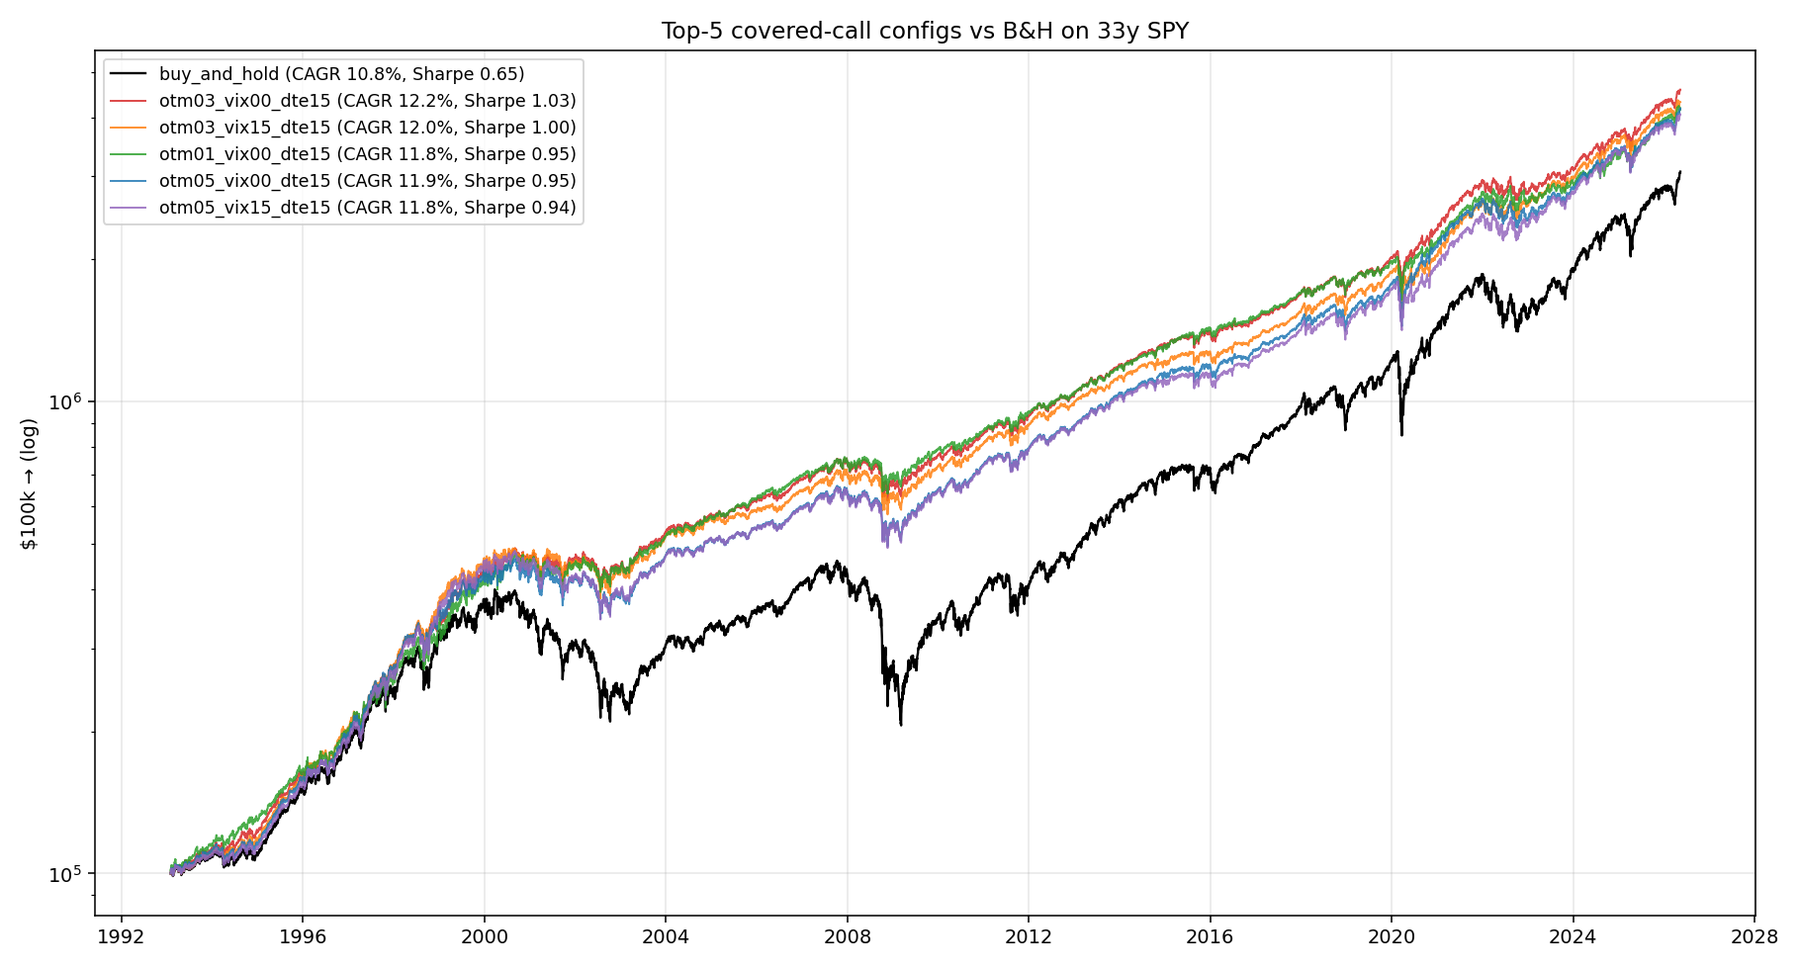
最优配置——按 33 年 Sharpe 排——是 3% OTM、15 DTE、no VIX timing。下面都基于这个组合。
最近 1-5 年实际赚了多少
按你哪一年开始这个策略:
| 起始 | 持有 | 纯 SPY | Covered Call | SPY MaxDD | CC MaxDD |
|---|---|---|---|---|---|
| 2019 | 7.4y | 17% | 13% | −34% | −20% |
| 2020 | 6.4y | 15% | 13% | −34% | −20% |
| 2021 | 5.4y | 15% | 13% | −25% | −12% |
| 2022 | 4.4y | 12% | 10% | −25% | −12% |
| 2023 | 3.4y | 23% | 16% | −19% | −12% |
| 2024 | 2.4y | 22% | 17% | −19% | −12% |
每一个起点,纯 SPY 都赢了 CAGR——而且差距不小,2-7 个百分点。差距最大的是 2023、2024 这两年牛市跑得太快,3% cap 每次被打穿都让出一大块。SPY 涨 6%,你只能拿到 3%,剩下的归 call buyer。
但右边两列别忽略。covered call 在事情走坏时损失大约是纯 SPY 的一半。最近 7 年是这样,过去 33 年里每一次主要 drawdown 事件都是这样——这不是 2020 年那一次的运气:
| 事件 | SPY MaxDD | CC MaxDD | CC 节省 |
|---|---|---|---|
| Dot-com (2000-2002) | −48% | −23% | 砍半 |
| GFC (2007-2009) | −55% | −20% | 砍 64% |
| COVID (2020 春) | −34% | −20% | 砍 42% |
| Fed 加息 (2022) | −25% | −11% | 砍 56% |
把整个 33 年的 drawdown 曲线叠在一起看更直观——每一次 SPY 探底,CC 那条线都浅得多。
这个 robustness 是策略真正的产品价值。目标是退休那天账户数字最大——别选这个,直接拿 SPY。目标是下次大跌时少难受一点——covered call 帮得上忙。两件事都对,但是两个不同的诉求。
把所有 rolling window 拿出来看
挑年份是有迷惑性的。诚实点的做法是把 1993-2026 所有可能的 5 年窗口都跑一遍:
| 最差 10% | 中位数 | 最好 10% | 路上 MaxDD | 5 年亏钱概率 | |
|---|---|---|---|---|---|
| 纯持 SPY | −1% | 11% | 20% | −55% | 15% |
| Covered call | 6% | 10% | 22% | −23% | 0% |
5 年中位数 return 基本打平。CC 最好的 10% 窗口反而比 SPY 还高一点(22% vs 20%),因为震荡市里 premium 一直在收,没被 cap 截掉太多。
最直白的卖点:33 年 SPY 数据里,没有任何一个 5 年滚动窗口 covered call 是亏钱的。但纯 SPY 有一堆 5 年窗口是亏的。2000 年 3 月开始持 SPY,5 年后还在亏;同时间开始 covered call,5 年后小赚。这是个真实可见的产品特性。
为啥最近几年 cap 卡这么狠
值得花一段说清楚。SPY 近 7 年 monthly return 中位数大概 +1.5%,但右尾很厚——偶尔有些月份 +6%、+8%、+10%。3% cap 不在乎中位数月,只在乎右尾月,因为那是它让钱跑掉的地方。
2024 年 1 月到现在 28 个月,3% cap 大概被打穿 9 次——三分之一的月份。每次平均让出 2% 的上涨。28 个月累计 7-10 个点丢出去。正好是上面起点表里 CC 跟 SPY 的差距。
那段时间的 premium 部分补偿,但只是部分。VIX 14 时 SPY 涨 6%,你那个月收 0.5% premium,让出 3% upside。账面是亏的。
反过来,stress 月相反。2020 年 3 月 VIX 飙到 82,covered call 一周能收 2% premium,而 SPY 在暴跌。2022 Q4 也类似。这些月份是把前一年的 drag 一把都赚回来。
我喜欢这么打比方:covered call 像洪水保险。大部分年份你在白交保费。真发洪水那年保险公司赔你的钱,把过去十年保费都赚回来。33 年 backtest 确认;5 年 backtest 也确认;但最近 5 年正好没发足够大的洪水,所以策略一直在“白交”,看起来很蠢。
三个看着聪明、实际无效的改良
VIX timing。“只在 VIX > 20 时卖 call”听起来很合理——拿走更厚的 premium。15、20、25、30 四档我们都测了,每一档都让策略变差。机制很机械:filter 更挑剔 → 卖更少 call → 更多时间没在收 premium。单次 premium 更厚那一点点,根本补不过来卖的次数变少。这个结论在其他短 vol 策略(wheel、covered call 不同 strike 组合)上也一致:对市场波动率择时,往往等于把自己择出市场。
Wider strikes。5%、7%、10% OTM。Premium 掉得比 cap 被打穿的频率掉得还快,策略漏血。7% 看得最清楚——premium 大约是 3% 的一半,但 cap 在大涨月还是被打穿三分之一。两头不讨好。
Longer DTE。30 / 45 / 60 天。反直觉的是:短期合约更优。15 DTE 循环捕捉到的 vol-of-vol 更多,单个糟糕月份的影响摊薄。Frictional cost(更多交易、更多 slippage)是主要代价,但策略扣完还是赢。
税这块比大家以为的重要
每次收的 premium,在 taxable account 里都是 STCG(short-term capital gains),按 ordinary income 交税。加州高收入者综合税率大约 45%(联邦 35% + 州 10%)。
举个数:纯 SPY 持 7 年再卖——LTCG,联邦 15-20%。Covered call 跑 7 年——每月 premium 按 ordinary income 全额纳税,股票还是 LTCG,但 premium 的税负是新增成本。
5 年中位数 return 税后估算(加州 top bracket):B&H 税前 11% → 税后约 9%。CC 税前 10% → 税后约 6.5%。税前打平变成税后差 2.5 个点。
放进 Roth IRA 或 401(k) 这事就消失了。Sharpe 优势和 drawdown 优势都白拿。所以每次有人问“该不该写 covered call”,我第一个反问基本都是“在什么账户里?”
不想自己写 call 的话:JEPI / JEPQ / QYLD / BXM 是什么
你不一定要每月跟 option chain 打交道。市面上有现成的 ETF 帮你做整套覆盖式 call 卖出,买一手 ticker 就完事。这几个产品名字你 reddit / Bogleheads 上肯定见过,简单说说每个到底是啥:
- JEPI (JPMorgan Equity Premium Income ETF)。2020 年 5 月发行,现在 AUM 30B 美元以上——是规模最大的 active ETF 之一。它的玩法:先选 100 只 S&P 500 里偏 low-vol 的大盘股(不是直接拿 SPY),然后通过一种叫 ELN(equity-linked note)的债权工具间接卖 call。年化分红 7-8%,每月发一次。Expense ratio 0.35%。Total return 在正常年份贴近 SPY,在 2022 这种波动大的年份跑赢 SPY,在 2023-2024 这种强牛市里跑输 SPY。基本是上面那个 covered call 策略的便利封装版。
- JEPQ (JPMorgan Nasdaq Equity Premium Income ETF)。2022 年 5 月发,同一个团队,标的换成 Nasdaq-100 的成分股。AUM ~15B。Expense ratio 0.35%。年化分红 9-11%,因为 Nasdaq 标的本身 vol 高,premium 更厚。波动也比 JEPI 大。
- QYLD (Global X NASDAQ 100 Covered Call ETF)。2013 年发,AUM ~7B。Expense ratio 0.60%。跟 JEPQ 的关键区别:QYLD 卖 at-the-money 的 call(不是 OTM),意味着把所有 upside 都让出去了,只留 premium。所以年化分红高达 12%,但是 total return 从 2013 年到现在远远跑输 QQQ(QQQ 复合年化 18%+,QYLD 复合年化 5% 左右)。QYLD 应该当成债券替代品(高收益分红),不要当成股票替代品。买了它就等于放弃了 Nasdaq 的长期增长。
- BXM (CBOE S&P 500 BuyWrite Monthly Index)。这是个指数,不是 ETF——CBOE 发布的官方 covered call 基准,每月卖 ATM call。学术界做 covered call 研究都拿它当对比基准。想直接买可以通过 PBP(Invesco S&P 500 BuyWrite)这个 ETF,AUM 比较小,liquidity 一般。
对大多数散户来说,直接买 JEPI 或 JEPQ 就是正解。这两个的 expense ratio (0.35%) 不算贵,扣完费用后的 risk-adjusted return 跟自己每月手写 3% covered call 差不了几个 bps。但省下来的麻烦不止那几个 bps——每年 12 次的下单、不停跟踪 bid-ask、记录每笔 premium 的 tax lot、年底报税时整理 1099-B——全都不用管了。ETF wrapper 把所有 operational overhead 都吃了。
QYLD 我一般不推荐。它的 ATM call 写法太极端,本质是把 Nasdaq 当债券用——只要 QQQ 是长期上行的(过去 20 年是),QYLD 就在持续放弃 alpha。除非你的诉求是纯月度现金流,不要资本增值(比如退休领固定收入),否则它的产品定位不适合你。
我有时会推荐 JEPI 给那些跟我说“我想要个 S&P income 策略”的人。它做的就是他们要的事。缺点跟手写 CC 一样——你拿 return 换 smoothness。这个交易还是那个交易。
反过来:买 call 行不行?
聊到这里有个自然的反问:你既然说卖 call 时间不好、VIX timing 没用——那如果反过来买 call 呢?
重要前提:买 call 和卖 covered call 是两套完全不同的策略。卖 covered call 是 short volatility,你赌的是 vol 比 market 定价的低;买 call 是 long volatility,你赌的是要么大涨要么 vol 涨。
买 call 主流有三种玩法,分别讨论:
- 短 DTE 长 call(≤30 天)——俗称“彩票”。Theta decay 极快——一个月不动,premium 衰掉 30%+。预期收益显著为负——这就是写 covered call 卖方的镜像,你付出的就是卖方赚到的。但偶尔 NVDA、TSLA 这种波动股一周翻倍时能赚 10 倍。我个人观点:别拿这个当策略用,当成偶尔小额下注的娱乐可以。不能拿来当 retirement bet。
- LEAPS(1-2 年长期 call)——retail 常用的合成 leverage 工具。买一个 $500 strike、2 年到期的 SPY call,付 $50/股的 premium,控制 $35k 的 SPY notional——effective leverage 大约 7 倍。Theta decay 慢得多——LEAPS 一年掉 5-15% premium,远比短期 call 友好。跟 leveraged ETF(TQQQ、UPRO)对比:LEAPS 是 path-independent 的(中间跌了再涨回来你还赚),但 leveraged ETF 是 daily reset 的(中间一跌一涨净亏 vol drag)。对 1-2 年 horizon 来说 LEAPS 通常胜出。
- Call spread(同时买一个低 strike、卖一个高 strike)——定义清楚最大盈亏。比纯长 call 便宜,但 upside 也封顶。适合“我看好 SPY 涨到 $XXX 但不超过 $YYY”这种有 view 的情况。
那 VIX timing 对买 call 有用吗? 理论上对:VIX 低 = IV 低 = call 便宜 = 该买;VIX 高 = call 贵 = 该卖。但实操有两个陷阱:(1) VIX 低通常是市场已经涨过一波的标志,这时候追买涨幅意义不大;(2) VIX 高常常是 SPY 在跌的时候,这时候你买 call 等于追跌博 V 型反转——胜率不高。我们没有专门测 long-call timing 的 backtest,这是后续 Exp 候选——但 industry 共识是:买 call 的胜率结构是“小亏多次、偶尔大赚”,跟卖方“小赚多次、偶尔大亏”刚好相反。
最朴素的总结:你这辈子的 99% 的钱不应该花在买 call 上。如果你已经长期看好 SPY,直接持有就行;如果想加杠杆,LEAPS 比频繁买短期 call 高效得多;如果想博特定事件(earnings、Fed),用 call spread 把最大损失定死。纯买短期 call 是给 covered call 卖方送钱的行为——刚好就是上面我们建议你扮演的那个角色。
我会怎么跟那个朋友说
如果他在看这篇——是,我觉得继续做,但我会换一件事:搬到 IRA 里去。这个策略本质是 Sharpe 优势的交易,不是 return 优势的交易。在 taxable account 里你的收益跟纯 SPY 几乎一样,但还得按 ordinary income 交税。放到 tax-advantaged account 里,数学就反过来了。你那 20 万 taxable 的仓位应该改纯 SPY;那 8 万 IRA 的仓位继续跑月度 3% covered call,正好是数据说该做的事——拿到接近 index 的 return,drawdown 减半。
另外顺便:别想对 VIX 择时;别拉宽 OTM。3% 月度是甜蜜点,更宽 premium 太少,更窄被卡太频繁。你已经在正确的配置上了,搬到正确的容器里就行。
还有一点要心里有数:这是个 regime-dependent 的交易。未来 5 年如果有一场真正的熊市,这个策略事后看会非常漂亮。如果像 2023-2024 那样持续 low-vol 慢牛,会继续跑输。你不知道抽到的是哪根签。其实这不是大问题——长期看 covered call 卖方在 30 年以上窗口里赢面更大。难受的地方在于“长期”可能比你拿得住的耐心要长。
一些技术细节
- Backtest 假设 frictionless。真实 slippage + commission 一年大约 30-50 bps。上面 CC 的 CAGR 数字得扣半个点再做对比。
- Black-Scholes + VIX 对 SPY 够准(10% 误差以内);放到单股 option 上误差是 5-15 倍,完全不能用。
- 最近 7 年画面被牛市严重偏置。要看含熊市窗口长啥样,看 1993-2026 rolling 分布表和上面的 drawdown 图。
- 2022 年之后期权市场结构已经完全不一样——0DTE、weekly options、零售大量卖 vol。可能压低未来 premium 水平。Backtest 把期权市场当静态的,没建模这块。可能比大家以为的影响要大。
- 长 call(买 call)那一段没有自己的 backtest 数据,是定性讨论,结论基于一般 option 期权理论 + industry 共识。要严格证明需要专门的 long-call 回测——后续 Exp 候选。
English
Dinner last month with a friend who’s been writing covered calls on SPY (the S&P 500 index ETF) since 2019. A “covered call” is selling a call option against shares you already hold — you cap your upside above some strike in exchange for cash premium (the price the option buyer pays you). Same routine every month: pick a strike a few percent above spot (out-of-the-money, OTM), sell the call, collect $5–10 a share, wait for expiration. Most months the contract dies worthless and he keeps the cash. A few months SPY rips past the strike and he gives up some upside.
The thing he kept turning over was the basic one. Was the option-writing actually paying him, or was he just donating upside to whoever was on the other side? He’d never had a clean way to back out the counterfactual — what “just held SPY” would have looked like over the same window — and that counterfactual is the whole game.
I ran the numbers across the full 33 years. Worse than I expected, and better than I expected, depending on what you’re actually trying to do.
The short version
Someone who held plain SPY since January 2019 has earned about 17 % a year. The same person running a 3-percent-OTM monthly call earned about 13 %. That’s four points of CAGR given up. On $200 k of notional, that’s roughly $8 000 a year of foregone return. Real money. Not “free money on top of.”
But that’s the wrong way to look at it. The covered-call version had half the drawdown when things went sideways — −12 % vs −34 % during the COVID crash, similar gap in late 2022. Sharpe was meaningfully better (about 1.0 vs 0.83). The strategy did exactly what it advertised: it traded peak return for a smoother ride. It just turns out “smoother ride” is a different product than “more money.” A lot of people writing covered calls don’t seem to know that.
A one-paragraph refresher on what we’re talking about
You own 100 shares of SPY. You sell someone the right to buy those shares from you at a price 3 % above today’s, expiring in 30 days. They hand you cash up front — call it $7 a share. If SPY closes below the strike at expiration, the contract dies and you keep both the shares and the cash. If SPY closes above, they take your shares at the strike, you give up everything above 3 %, but you still keep the cash. Either way, the premium is yours forever. The cost is the cap. That’s the whole product.
(There’s a more elaborate version where you also try to time when to sell — only write calls when VIX is above 20, that sort of thing. We tested those too. They don’t help. More on this below.)
What we actually tested
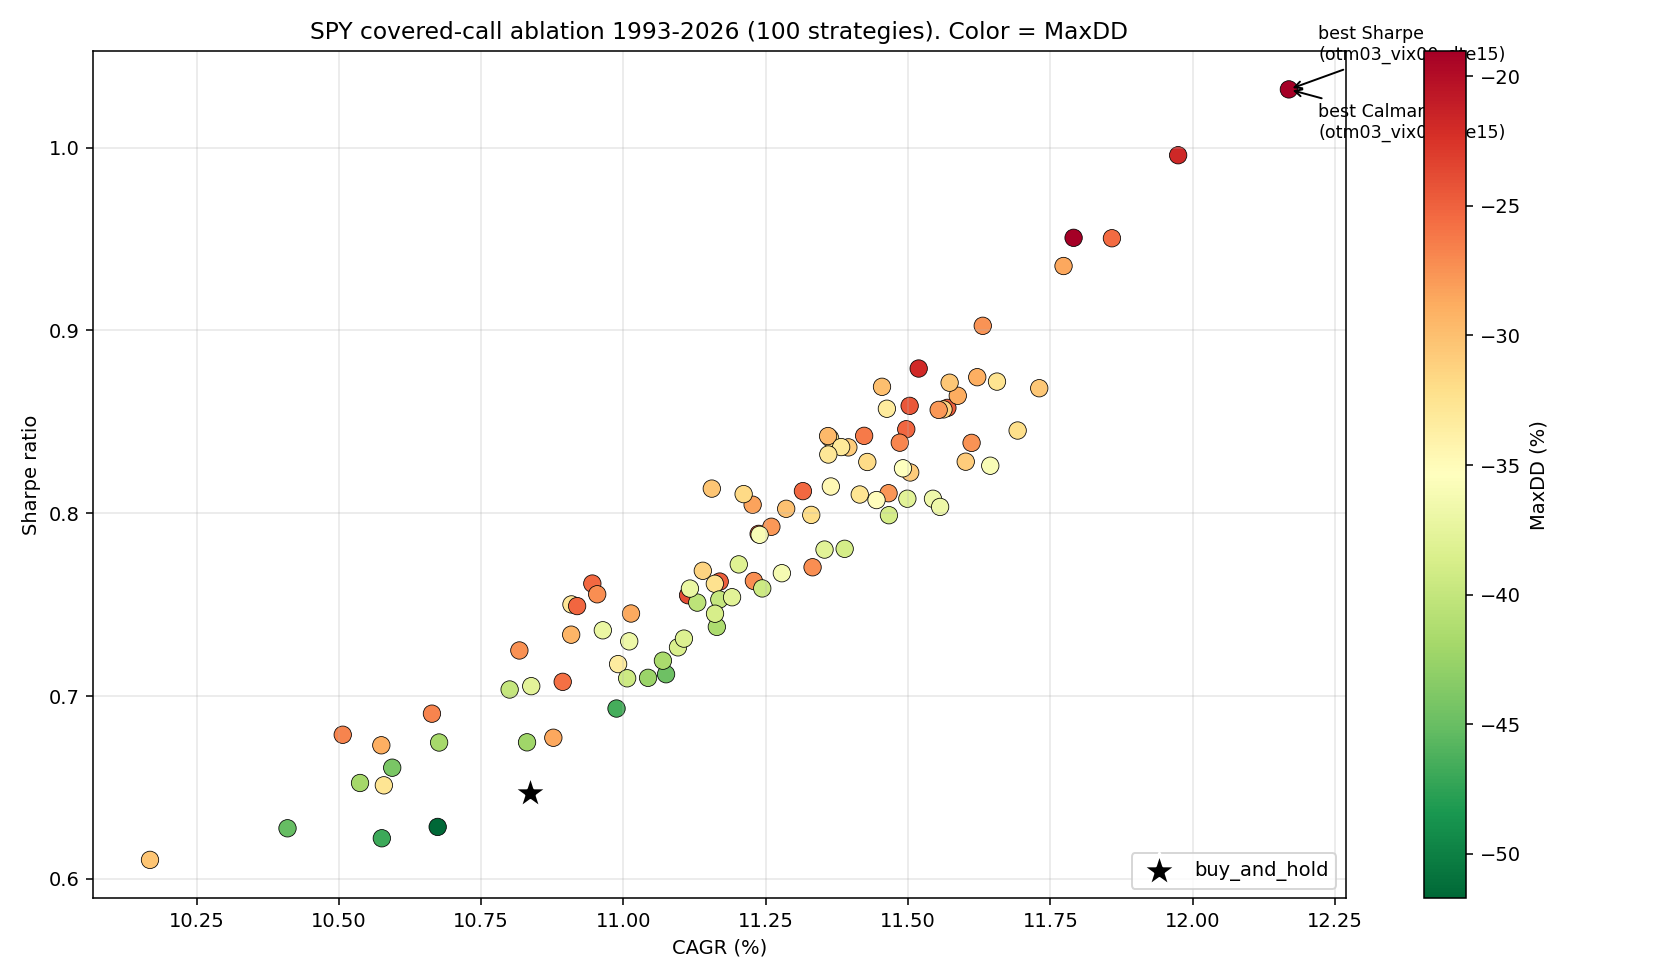
The backtest grinds through every combination of strike width (1 / 3 / 5 / 7 / 10 % OTM), contract length (15 / 30 / 45 / 60 days), and VIX gate (always on, or only when VIX exceeds 15 / 20 / 25 / 30). That’s 100 configurations, applied to SPY from January 1993 through May 2026. The call premiums come from Black-Scholes with VIX plugged in as the implied vol — for SPY that’s within ~10 % of real market mids, so it’s fine for this purpose. (This trick only works for broad-index options like SPY and QQQ. For single-stock options on names like NVDA or TSLA, the implied vol runs 2-3× higher than VIX, and Black-Scholes-with-VIX understates the real premium by a factor of 5-15. Single-stock option strategies require per-name IV or actual market quotes, not this shortcut.)
The winning configuration — best Sharpe over the long history — is 3 % OTM, 15-day contracts, no VIX timing. That setup is the basis for everything below.
What the last 1-5 years actually paid
Here’s what someone running the 3 % OTM monthly call would have earned compared to just owning SPY, depending on when they started:
| Started in | Years held | Buy-and-hold | Covered call | SPY drawdown | CC drawdown |
|---|---|---|---|---|---|
| 2019 | 7.4 | 17 % | 13 % | −34 % | −20 % |
| 2020 | 6.4 | 15 % | 13 % | −34 % | −20 % |
| 2021 | 5.4 | 15 % | 13 % | −25 % | −12 % |
| 2022 | 4.4 | 12 % | 10 % | −25 % | −12 % |
| 2023 | 3.4 | 23 % | 16 % | −19 % | −12 % |
| 2024 | 2.4 | 22 % | 17 % | −19 % | −12 % |
Buy-and-hold won on CAGR in every recent window. By 2–7 percentage points. The gap is bigger when the bull market is faster — 2023 and 2024 specifically were brutal for the cap-on-upside trade, because SPY kept rallying past the 3 % strike. Every month it ripped, the strategy left a few percent on the table.
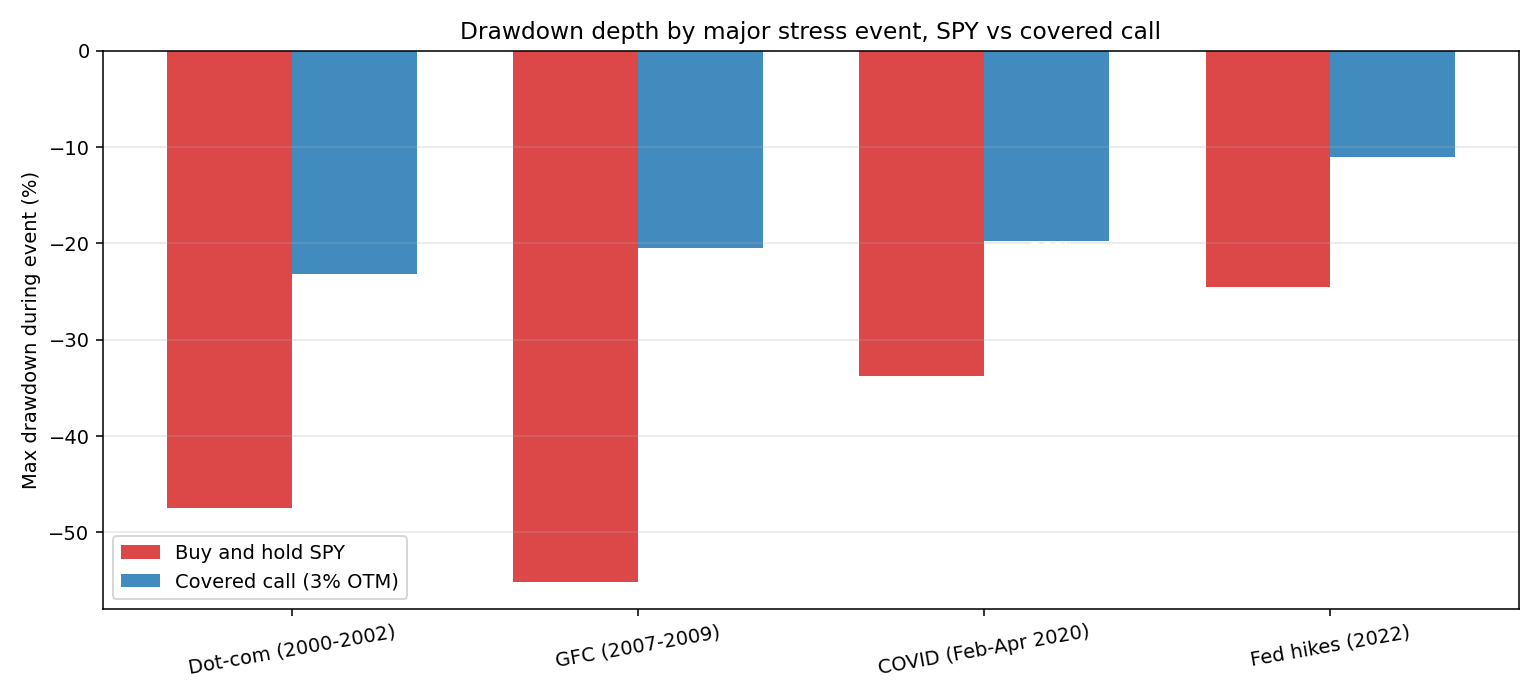
But look at the drawdown column. The covered call lost about half as much when things went bad. This isn’t a 2020 fluke — it’s been true in every major stress event across 33 years of SPY data:
| Event | SPY MaxDD | CC MaxDD | CC saved |
|---|---|---|---|
| Dot-com (2000-2002) | −48 % | −23 % | half |
| GFC (2007-2009) | −55 % | −20 % | 64 % cut |
| COVID (Spring 2020) | −34 % | −20 % | 42 % cut |
| Fed hikes (2022) | −25 % | −11 % | 56 % cut |
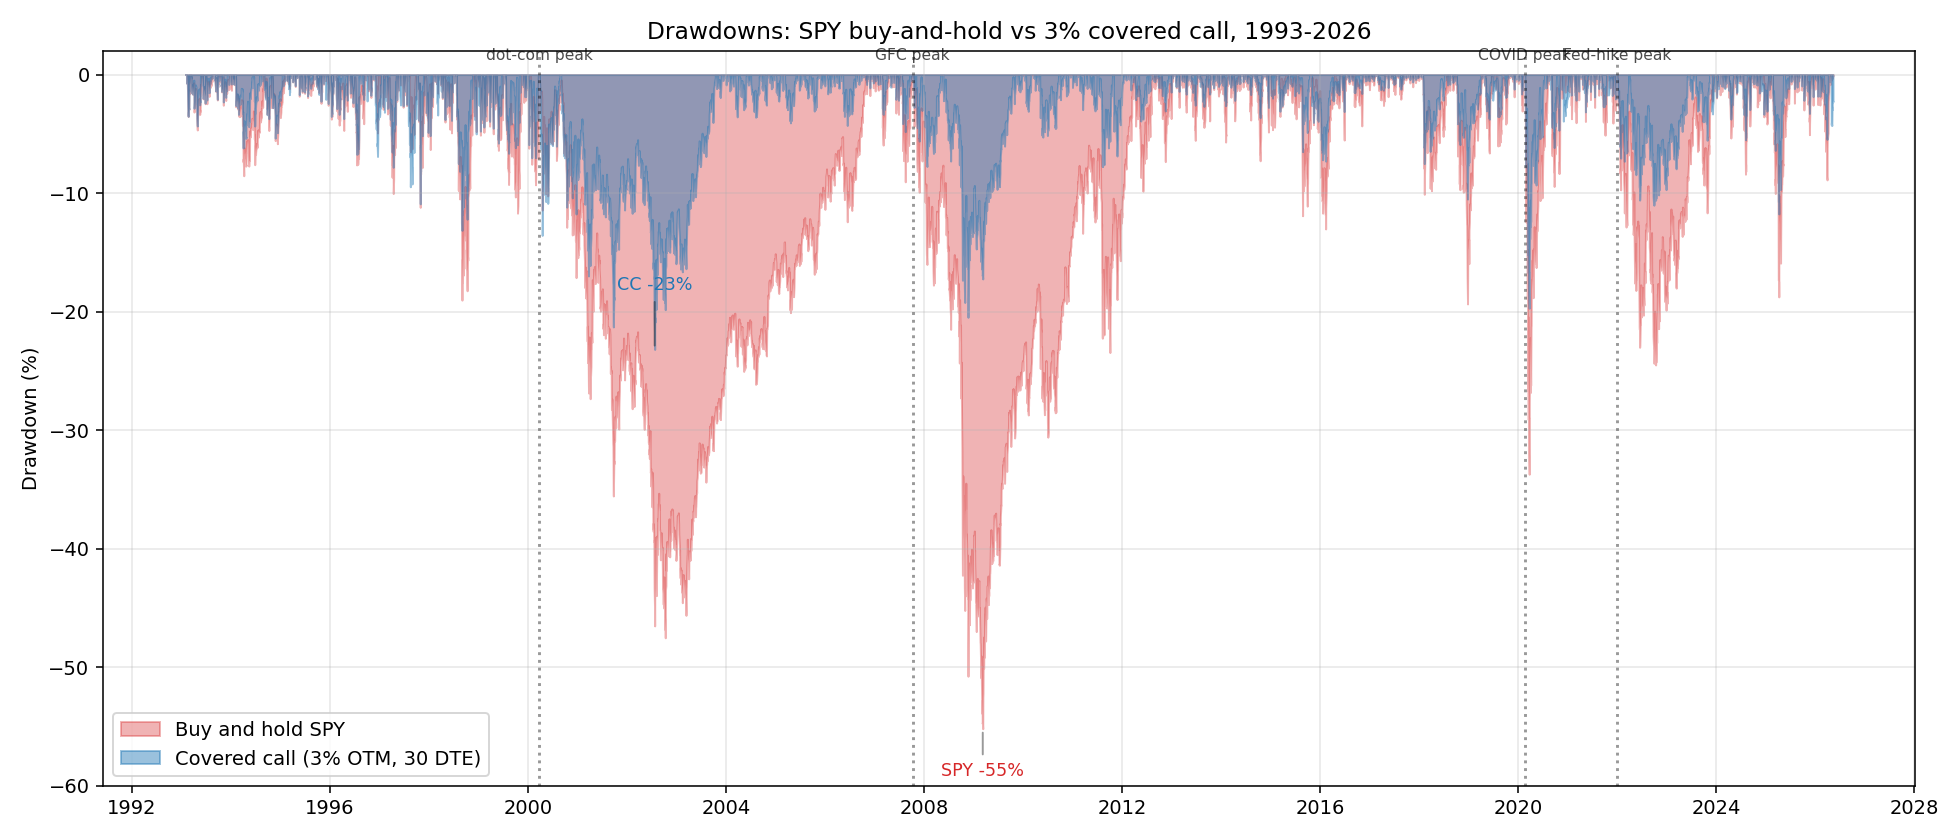
Or overlay the whole 33-year drawdown curve — every time SPY drops, the CC line is meaningfully shallower.
That robustness is the actual product. If you’re trying to maximize the number on your statement at retirement, you should know going in: this is not the right strategy. Just hold SPY. If you’re going to look at your account during the next sell-off and you’d like to feel a bit less awful, covered call helps. Both can be true.
The rolling-window picture
The recent-start table can be misleading — we picked specific years. A more honest version is “what did every possible 1-year, 3-year, and 5-year window look like since 1993?” The 5-year version:
| Worst 10 % | Median | Best 10 % | Worst drawdown along the way | Lost money over 5 years | |
|---|---|---|---|---|---|
| Buy-and-hold | −1 % | 11 % | 20 % | −55 % | 15 % of windows |
| Covered call | 6 % | 10 % | 22 % | −23 % | 0 % of windows |
A 5-year median return basically identical. The cap on upside makes the best windows roughly equal (22 % for CC, 20 % for B&H — the premium catches up when bull rallies are mild and the market spends time chopping around). The cap binds hardest in the worst windows for the underlying, where the option-writer is collecting fat premium during stress and that fully covers what they give up on the cap.
Here’s the part I find most useful: in 33 years of SPY data, there has been no 5-year window where the covered call lost money. There have been a fair number of 5-year windows where plain SPY lost money. If you started a 5-year hold of SPY in March 2000, you ended it underwater. The covered-call version would have ended slightly positive. That’s an actual product feature.
Why the cap binds so much lately
Worth taking a beat to understand why the recent windows look so bad for covered call. SPY’s median monthly return over the last 7 years has been about +1.5 %, but with a fat right tail — a handful of months at +6 %, +8 %, +10 %. A 3 % cap doesn’t care about the median month. It cares about those right-tail months, because they’re where it leaves money on the table.
Across the 28 months from January 2024 to today, the 3 % cap bit roughly 9 times — about a third of the months. Each bind cost an average of 2 % of upside. Cumulative drag over those 28 months: 7-10 percentage points of return given up. That’s exactly the gap you see in the recent-start table.
The premium received during those months partly compensates, but only partly. When VIX is 14 and SPY rips +6 %, you collected 0.5 % in premium and gave up 3 %. Math doesn’t work.
The mirror happens in stress months. March 2020: VIX peaked at 82, the strategy was collecting roughly 2 % a week in premium while SPY itself was dropping. Same story Q4 2022. Those are the months where covered call earns back the previous year’s drag and then some.
I think of it like flood insurance. Most years you’re paying a premium for nothing. In a flood year you collect, and the math works out over a long enough cycle. The 33-year backtest confirms it. The 5-year backtest confirms it. The last 5 years specifically don’t, because there was no flood big enough to matter.
Three things I tried that didn’t help
Timing on VIX. “Only sell calls when VIX is above 20” sounds clever — collect richer premium in fear regimes. We tested it at thresholds of 15, 20, 25, 30. Every threshold made the strategy worse. The mechanism is mechanical: filter more selectively → sell fewer calls → spend more time not collecting premium. The richer per-trade premium doesn’t compensate for the lower count. We see the same result across every short-vol strategy variant we’ve tested (wheel, different covered-call strikes, etc). Timing the market’s volatility tends to time you out of the market.
Wider strikes. 5 %, 7 %, 10 % OTM. The premium drops faster than the cap-binding rate drops, so the strategy bleeds. The data is clearest at 7 % — premium roughly half of the 3 % version, but the cap still binds in about a third of strong months. Worst of both worlds.
Longer-dated contracts. 30 / 45 / 60 day cycles. Counterintuitively, shorter dominates. 15-day cycles capture more of the volatility-of-volatility — you reset more frequently, so a single bad month hurts less than it does on a 60-day position. Calendar friction is the main cost (more trades, more slippage), but the strategy still wins after that.
Taxes are a bigger deal than people admit
Every premium you collect counts as short-term capital gains in a taxable account. That’s ordinary income. A high earner in California is paying 35 % federal + 10 % state = a 45 % blended rate on that premium.
A quick worked example. Plain SPY held 7 years and sold: long-term capital gains, 15-20 % federal. Covered call run for 7 years: the premium is taxed every month at full ordinary income, the shares accumulate LTCG, but the premium drag is the new component.
Rough after-tax math on 5-year median returns, California top-bracket: B&H goes from 11 % pre-tax to about 9 % post-tax. Covered call goes from 10 % pre-tax to about 6.5 % post-tax. The pre-tax tie becomes a 2.5-point post-tax loss for covered call.
In a Roth IRA or 401(k) this difference vanishes. The Sharpe and drawdown benefits are real and free of tax drag. Which is why my actual answer to “should I run covered calls” usually starts with “in what kind of account?”
What if you don’t want to write calls yourself? JEPI / JEPQ / QYLD / BXM, explained
You don’t have to deal with the option chain every month. There are ETFs that bundle the whole covered-call program into one ticker. You’ve probably seen these names on Reddit or Bogleheads — here’s what each one actually is:
- JEPI (JPMorgan Equity Premium Income ETF). Launched May 2020. Currently over $30 billion in assets — one of the largest actively-managed ETFs in the world. The mechanism: a portfolio manager picks ~100 low-volatility S&P 500 names (not just SPY itself), then writes call options through equity-linked notes (ELNs) rather than directly. Distributes about 7-8 % a year, paid monthly. Expense ratio 0.35 %. Total return roughly tracks SPY in normal years, beats SPY in volatile years like 2022, and lags SPY in strong bull years like 2023-2024. Basically a turnkey version of the strategy this study models.
- JEPQ (JPMorgan Nasdaq Equity Premium Income ETF). Launched May 2022, same team, but the underlying is Nasdaq-100 names. About $15 B AUM. Expense ratio 0.35 %. Yields 9-11 % annually because Nasdaq names are more volatile, so the premium is fatter. More drawdown than JEPI as a result.
- QYLD (Global X NASDAQ 100 Covered Call ETF). Launched 2013. About $7 B AUM. Expense ratio 0.60 %. Key difference from JEPQ: QYLD writes at-the-money calls (not OTM), meaning it gives up all upside in exchange for maximum premium. Yields about 12 % a year, but total return has badly underperformed QQQ — QQQ has compounded at ~18 %/year since QYLD launched, QYLD at about 5 %. Treat QYLD as a bond substitute (high yield), not an equity substitute. Buying it means accepting that you give up Nasdaq’s long-run growth.
- BXM (CBOE S&P 500 BuyWrite Monthly Index). This is an index, not an ETF — the official CBOE benchmark for covered-call strategies, simulating a monthly ATM call write on SPX. Academic studies of covered-call strategies use this as the standard comparison. Tradeable via PBP (Invesco S&P 500 BuyWrite), but PBP’s AUM is small and liquidity is uneven.
For most retail traders, JEPI or JEPQ is the right answer. The 0.35 % expense ratio is reasonable, and the after-fee risk-adjusted return runs within a few basis points of the self-managed version. What you actually save is the operational drag — 12 trades a year of order entry, ongoing bid-ask tracking, monthly tax-lot bookkeeping, year-end 1099-B reconciliation. The ETF wrapper eats all of that.
QYLD I generally don’t recommend. The ATM call write is too aggressive — it’s effectively converting Nasdaq into a bond. As long as QQQ is in a long-term uptrend (it has been for 20+ years), QYLD bleeds alpha every month. Unless your specific goal is pure monthly cash flow with no capital appreciation (a retiree pulling fixed income, say), QYLD’s product design doesn’t match your need.
I sometimes recommend JEPI to people who tell me they want “an income strategy on the S&P.” It does the thing they’re asking for. The downside is the same as the downside of self-managed covered calls — you’re trading return for smoothness. That’s still the deal.
Flipping it: what about buying calls?
Natural follow-up at this point: if selling calls and trying to time on VIX both don’t work — what if you flip the trade and buy calls instead?
Important framing first: buying calls and writing covered calls are not the same strategy class. Writing covered calls is short volatility — you’re betting the market is over-pricing future moves. Buying calls is long volatility — you’re betting the market is under-pricing, or that you have a directional view that will pay enough to overcome theta decay.
Three mainstream long-call setups, briefly:
- Short-dated long calls (≤ 30 DTE) — colloquially “lottery tickets.” Theta decay is brutal — if the underlying doesn’t move, you lose ~30 % of premium in a month. Expected return is clearly negative — this is the mirror image of writing covered calls; what the seller earns, the buyer pays. The occasional NVDA or TSLA that doubles in a week pays 10×, which is what keeps people playing. Honest take: don’t run this as a strategy. Treat it as recreational small bets if you want; never as a retirement allocation.
- LEAPS (1-2 year long calls) — the standard retail synthetic-leverage tool. Buy a 2-year SPY $500 call for $50/share, you control $35 k of SPY notional at about 7× effective leverage. Theta decay is much milder — a LEAPS loses 5-15 % of premium per year, far less than short-dated. Versus leveraged ETFs (TQQQ, UPRO): LEAPS are path-independent (a mid-period crash and recovery still nets you upside), while leveraged ETFs reset daily (the same crash-and-recovery costs you vol drag). For 1-2 year horizons, LEAPS typically beat leveraged ETFs.
- Call spreads (buy a lower-strike call, sell a higher-strike call) — defines maximum profit and loss. Cheaper than a naked long call, but caps the upside. Right tool when you have a view like “I think SPY rallies to $XXX but not past $YYY.”
Does VIX timing work for buying calls? Theoretically yes: low VIX = cheap calls = good to buy; high VIX = expensive calls = good to sell. Two practical traps: (1) low VIX usually means the market has already rallied, so chasing more upside has diminishing returns; (2) high VIX usually means SPY is falling, so buying calls then is buying a V-shaped recovery bet — historically a low-success setup. We didn’t run a specific long-call-timing backtest — that’s a candidate for a future experiment. But the industry consensus is that long-call P&L is structured “many small losses, occasional big wins,” exactly the inverse of the seller’s “many small wins, occasional big losses.”
The blunt summary: 99 % of your investing dollars should not be in long calls. If you’re long-term bullish SPY, just hold SPY. If you want leverage, LEAPS are more efficient than rolling short-dated calls. If you want to express a specific event view (earnings, Fed), use a call spread to cap downside. Pure short-dated long calls are a way to donate money to covered-call writers — which is, conveniently, exactly the role this report has been suggesting you should play instead.
What I’d actually tell my friend
If he’s reading this — yes, I think you should keep doing it, but I’d change one thing. Move it to an IRA. The strategy is a Sharpe trade, not a return trade. You’re paying ordinary income tax on a return that pre-tax barely beats buy-and-hold. In a tax-advantaged account that arithmetic flips. Your $200k taxable position would be better off in plain SPY. Your $80k IRA running the same monthly 3 % covered call is doing exactly what the data says it should — earning roughly the index, with half the bad days.
Also, while we’re at it: don’t try to time VIX. Don’t widen the strikes. The 3 % monthly is the sweet spot for a reason — wider gives up too much premium, narrower binds too often. You’re already running the right configuration. Just put it in the right wrapper.
The other thing to keep in mind: this is a regime-dependent trade. If the next five years contain a real bear market, the strategy is going to look brilliant in retrospect. If they look like 2023-2024 — a sustained, mild-vol grind upward — it’ll keep underperforming. You don’t know in advance which one you’re getting. That’s actually fine; the long-run odds favor the covered-call seller over very long windows. The frustrating part is that “long-run” might mean longer than the time you’re patient enough to hold.
Boring stuff
- Backtest assumes frictionless execution. Real-world costs (slippage + commission) run about 30-50 bps a year. Subtract half a point from the covered-call CAGR numbers above to compare fairly.
- Black-Scholes with VIX is accurate enough for SPY (within ~10 % of market mids). For single-stock options the same method understates real premium by a factor of 5-15 — don’t use it for NVDA/TSLA-style names.
- The recent 7-year picture is heavily bull-biased. The drawdown chart above and the 1993-2026 rolling distribution table show what bear-containing windows actually look like.
- The options market structure since 2022 (0DTE, weeklies, much higher retail vol selling) might compress future premium relative to the 33-year sample. We didn’t model that — the backtest treats the option market as static. Could be a bigger deal than people realize.
- The long-call (buy-call) discussion above is qualitative — based on standard option theory and industry consensus, not a dedicated backtest. A long-call-timing study is a candidate for a future experiment.
Files
experiments/exp_37_covered_call_ablation.py-
summary.csv— all 100 configurations. -
windowed_perf.csv,windowed_perf_horizon.csv— rolling 1-5y distributions. -
recent_starts.csv— CAGRs by start year. -
subperiod_perf.csv— bull-vs-bear decomposition. -
plots/— equity curves and ablation heatmaps.