QUANT · MAY 2026
The wheel 策略到底赚不赚
Does the wheel strategy actually make money?
中文
YouTube 上有个频道每周都教“the wheel”策略:在 SPY(S&P 500 指数 ETF)上卖 cash-secured put(卖出一个 put 期权,同时把 strike × 100 美元的现金锁住当抵押),赌它不会跌穿你的 strike(行权价);万一跌穿了就被 assign(按 strike 强制买入股票),再卖 covered call(持股 + 卖个 call,把上涨封顶换 premium),再赌它不会涨过你的 strike。99% 的单子都是赚钱的,主播每次都把这个数字打在缩略图上。看起来稳得不能再稳。
我跑了 33 年的数据,又跑了最近 1-5 年的窗口。这里讲讲 99% 胜率最后到底变成多少钱,以及为什么这玩意儿不该是你 SPY 的主策略。
短答
2024 年 1 月开始在 SPY 上跑那个 99% 胜率的 wheel(10% OTM strike),到 2026 年 5 月的 CAGR 是 0.4%——基本是 money-market fund 的水平。同一段时间纯持 SPY 是 22%。
把 strike 拉近到 5% OTM,会好一点,CAGR 5.7%——但仍然只有 SPY 的四分之一。最激进的 2% OTM 拿到 11.9%,跟 SPY 比也还差 10 个百分点。每一种 wheel 配置、每一个起始年份、都跑输纯持 SPY。这跟 YouTube 主播没告诉你的事正好相反。
胜率高跟最终赚多少钱是两件事。下面会用一张图把这件事讲死。
一段话讲机制
第一步:你手里是现金。你卖一个 SPY 的 cash-secured put——比如 strike 比现价低 5%、期限一个月——同时把 strike × 100 美元的现金锁起来当抵押。对方付你 premium。到期:要么 SPY 还在 strike 之上,put 归零,你保留 premium + 现金;要么 SPY 跌穿了 strike,你被 assign,按 strike 买入 100 股 SPY。
第二步:现在你手里是股票了。卖一个 covered call——比如 strike 比现价高 5%、期限一个月。到期:要么 SPY 在 strike 之下,call 归零,你保留 premium + 股票;要么 SPY 涨穿了 strike,你被 assign 把股票按 strike 卖掉,重新拿回现金。
回到第一步。循环往复。所以叫 wheel——一个永动机似的循环结构。Phase A 你在现金状态卖 put,Phase B 你在股票状态卖 call。营销点:每一笔交易要么 expire worthless(你赚 premium),要么 assign(你拿到你本来就想要的那个 position)。听起来确实没什么能输的。
我们测了啥
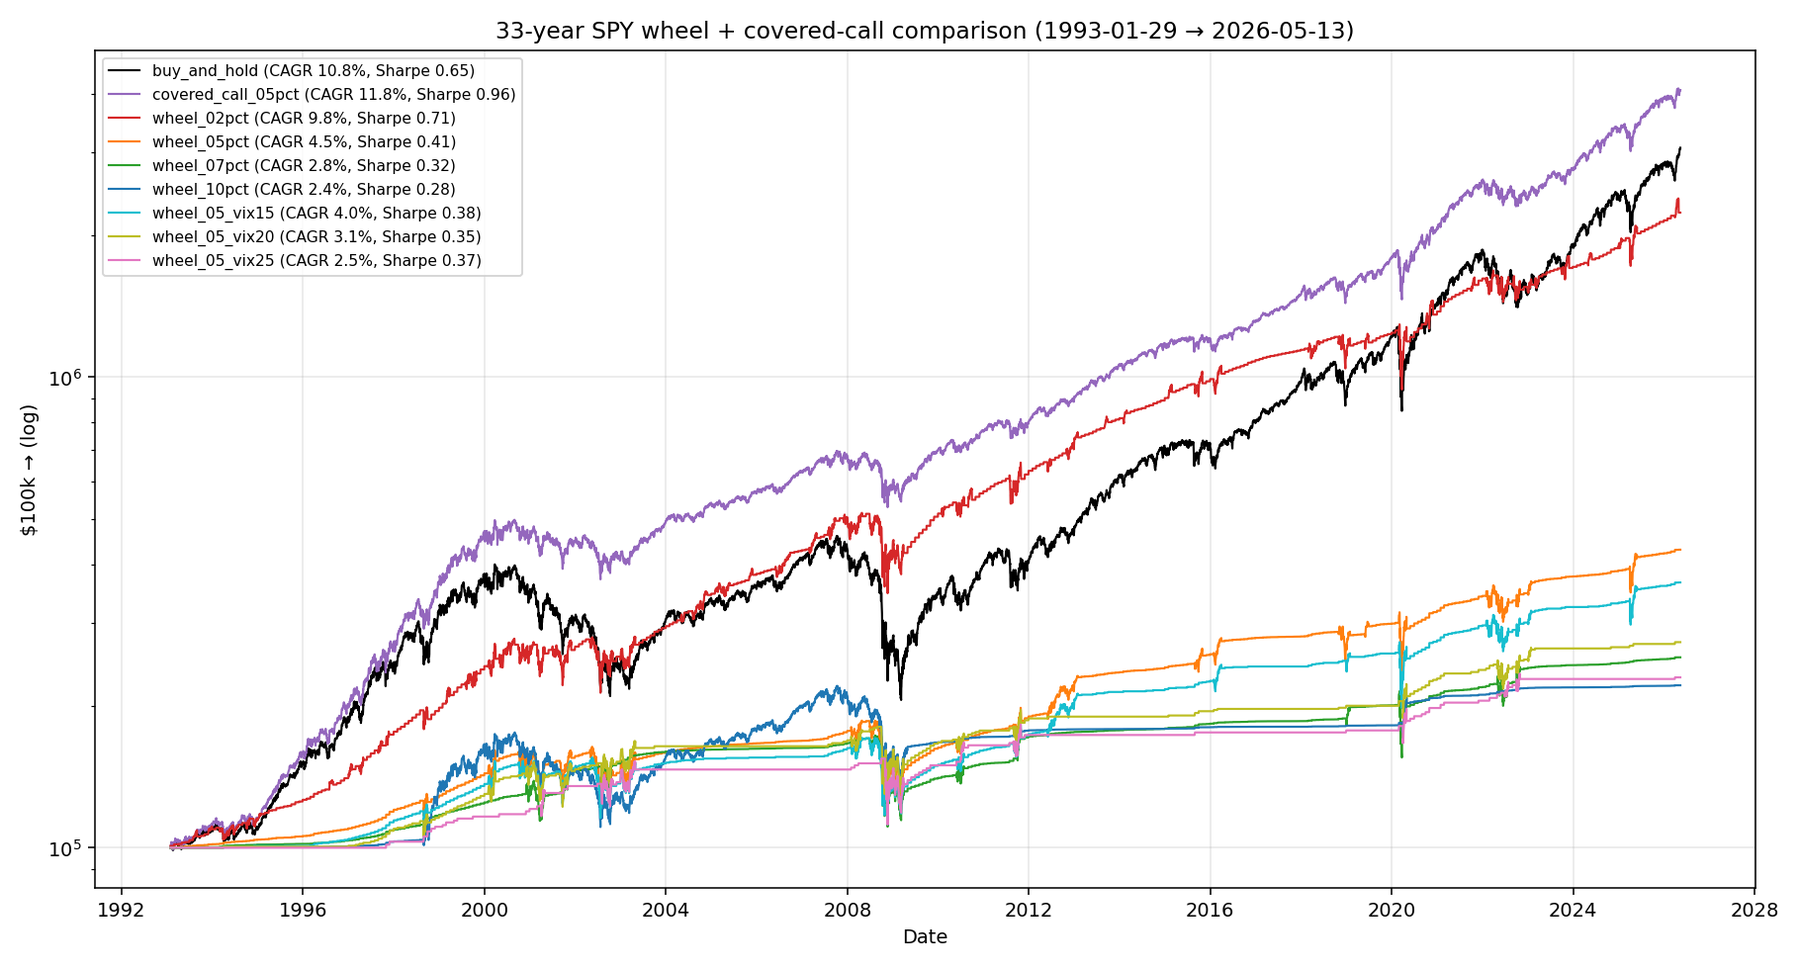
8 个 wheel 变种 + covered call + 纯持 SPY。Strike 距离 2 / 5 / 7 / 10% OTM。还有 VIX gated 版本(只在 VIX > 15、20、25 时才卖)。Monthly cycle,1993-01 到 2026-05,33 年的 SPY 数据,覆盖科技泡沫、08 金融危机、新冠、22 加息。Premium 用 Black-Scholes 算,VIX 当 implied vol——对 SPY 来说跟市场 mid 误差 10% 以内,可以接受。
最近 1-5 年实际赚了多少
按你哪一年开始:
| 起始 | 持有 | 纯 SPY | CC 5% | Wheel 2% | Wheel 5% | Wheel 10% |
|---|---|---|---|---|---|---|
| 2019 | 7.4y | 17.6% | 14.5% | 9.7% | 6.5% | 2.7% |
| 2020 | 6.4y | 15.5% | 13.7% | 9.7% | 5.9% | 3.1% |
| 2021 | 5.4y | 15.5% | 13.6% | 9.5% | 5.7% | 1.2% |
| 2022 | 4.4y | 12.1% | 10.6% | 7.7% | 5.3% | 1.1% |
| 2023 | 3.4y | 23.5% | 17.0% | 12.3% | 6.7% | 0.4% |
| 2024 | 2.4y | 22.5% | 17.7% | 11.9% | 5.7% | 0.4% |
读这张表三个要点:
1. 纯 SPY 在每个起始年份都赢了 CAGR——差距从 8 个点(vs wheel-2%)到 22 个点(vs wheel-10%)。
2. Covered call(永远持股、每月卖 call)也在每个窗口里都打赢 wheel——同样的工具(SPY + 月度 option),更简单的结构,更好的结果。如果你确定要做 SPY income 策略,用 covered call 不要用 wheel。
3. Wheel-10% 起始 2024 = 0.4% CAGR——跟现金没区别。这是因为 10% OTM 的 put 在 24 年慢牛里几乎从来不会 assign,所以仓位一直在现金状态收薄薄的 premium,而 SPY 自己在猛涨。这是 wheel 最坏情况的完整展现。
回撤一列倒是 wheel 唯一有优势的地方:
| 起始 | SPY MaxDD | CC MaxDD | Wheel 5% MaxDD | Wheel 10% MaxDD |
|---|---|---|---|---|
| 2019 | −34% | −21% | −28% | −5% |
| 2022 | −25% | −12% | −16% | 0% |
| 2024 | −19% | −12% | −12% | 0% |
Wheel-10% 在 2.4 年里完全没有回撤——0%。代价就是 0.4% 的 CAGR。这其实就是 wheel 真正的产品:保险级别的平滑度,外加保险公司利润级别的收益。
Vanity metric 陷阱——这一张图说完
把 33 年的胜率跟最终财富画在一起:
| Variant | 卖 put 数 | Put 胜率 | 卖 call 数 | Call 胜率 |
|---|---|---|---|---|
| Wheel 2% | 275 | 80% | 125 | 55% |
| Wheel 5% | 333 | 94% | 67 | 70% |
| Wheel 7% | 370 | 97% | 30 | 63% |
| Wheel 10% | 271 | 99% | 129 | 98% |
Wheel-10% 在 33 年里卖了 271 个 put,只有 2 个被 assign。卖了 129 个 call,只有 2 个被 assign。基本每一笔交易都是赢的。
最终账户值:$221,000($100k 本金起步)。
同期纯持 SPY:$3,070,000。
差 14 倍。
这就是大家说“胜率是 vanity metric”的意思。一个抛硬币玩法:正面赔你 $1,反面让你输 $100——胜率 50%,期望值灾难。Wheel-10% 是 option income 的同款故事:每笔交易几乎都赚,但每笔赚得太少,连现金都跑不赢,更别说股票。
最终账户上的钱才是衡量标准,不是单笔的胜率。
如果有人卖 wheel 策略给你,第一句话就是“99% win rate”——你去问他要多年 CAGR 跟纯持 SPY 的对比。如果他不给,他要么不懂这个数学、要么指望你不懂。
Wheel 到底花了多少时间在等
最直观的角度是看每天的仓位状态:
| Variant | 持股天数 | 持现金天数 |
|---|---|---|
| Covered call | 100% | 0% |
| Wheel 2% | 31% | 69% |
| Wheel 5% | 17% | 83% |
| Wheel 7% | 8% | 92% |
| Wheel 10% | 32% | 68% |
经典的 5% OTM wheel 83% 的时间在现金状态。SPY 一年涨 10%,现金一年涨 5%,premium 一年加 3-4%。算一下:你 83% 的时间在拿 5+3=8% 的回报,只有 17% 的时间拿到完整的 10%——加权平均还不到 9%。这就是为什么不可能跑赢 SPY。
(Wheel-10% 的 32% 是个反常现象。那种远的 put 一旦真的 assign,对应的 call 又几乎不可能 assign——所以你长期持股但每月几乎不收 premium。这是另一种死法。)
那 wheel 啥时候有用?
7-22 个点的 CAGR gap 把 wheel 否决成不能做长期主仓策略。但有三个具体场景里它确实能用:
用法一:当 entry 操作,不当策略。你今天想在 $440 买 SPY,现在它在 $460。你不下 $440 的 limit order,而是去卖一个 30 天到期、strike $440 的 cash-secured put。如果一个月内 SPY 跌到 $440,你被 assign——跟 limit order 效果一样,但额外收了 premium。如果 SPY 没跌到,你白收了 premium,下个月再试。这不是 wheel——这是 put-sell-as-limit-order。7-22 个点的 gap 不适用,因为对比对象是“在 $440 等着”,不是“永远跑 wheel”。这是一个一次性的入场战术。
用法二:在分红股上跑,不是在 SPY 上。Wheel 的 cash phase 在 SPY 上是浪费的,因为 SPY 的正常回报正好是你的机会成本。但在你本来就想长期持有的分红股(KO、JNJ、VZ)或者刚跌过的周期股(XOM、BAC)上,wheel 的结构就合理多了——这些股票的 premium 通常高过 SPY,而且“cash phase”换的是你本来就要持有的债券类资产,不是股票类资产。机会成本变了,数学就变了。
用法三:当固收 sleeve 的一部分。如果你本来要持有现金或者短债,把一部分换成 cash-secured put(卖在你愿意拥有的股票上),把现金的 4% 回报变成 6-8% 的 premium+现金。对比对象是现金,不是股票。Wheel 跑赢现金。它不跑赢股票。
除了这三种,wheel 是个“找用途的策略”——被包装成“股票替代”,但它根本不是。
反过来:买 put 行不行?
聊到这里有个自然反问:既然卖 put 在 SPY 上效果这么差——那如果反过来买 put 呢?
前提:卖 cash-secured put 是 short volatility,你赌 SPY 不会跌穿;买 put 是 long volatility / 看跌方向,你赌 SPY 跌穿,或者用 put 做下行保险。
买 put 主流三种玩法:
- 保护性 put(protective put)——你已经持有 SPY,再买一个 OTM put 锁死 downside。等于花 premium 给你的仓位买保险。代价:每年大约 1-3% 的 premium,把整体 CAGR 拉低;好处:把 MaxDD 限制在 put strike 那个位置。Backtest 显示长期来看 cost 比 benefit 大——主流学术结论是“persistent protective put 长期跑输纯持有”。但在你真的有事件性下跌担忧时(财报、Fed 决议)是合理的短期工具。
- 短 DTE 买 put 投机——觉得 SPY 要跌,买近月 put。Theta 衰减很快,预期收益显著为负。跟“买 call 彩票”是镜像。不要拿来当策略。
- Put spread(买近的 put、卖远的 put)——定义最大盈亏的看跌策略。比纯买 put 便宜,但 downside 也封顶。适合“我觉得 SPY 会跌但不会跌穿 $YYY”的情况。
VIX 高的时候买 put 划算吗? 反直觉的是:通常不。VIX 高常常说明市场已经在跌或刚跌过,这时候 put 的 implied vol 已经被打高了,你买在贵的位置;VIX 低的时候市场在涨,没人想要 put 保险,但你买的成本最便宜。所以“VIX 低时买 put”理论上更合理——但这又跟“VIX 低市场在涨、你为什么要买 put 保险”的实操矛盾。买 put 的择时困境就在这儿。
最朴素的结论:绝大多数散户不应该把买 put 当主策略。如果你长期看好 SPY,直接持有就行。如果担心特定事件,用 put spread 限制成本。如果你真的觉得 SPY 要崩盘,减仓比买 put 高效得多——卖 SPY 没有 theta decay。
税这块比大部分人以为的重要
每次 wheel 收到的 premium,taxable account 里都是 STCG,按 ordinary income 交。Wheel 70% 的 put 都 expire worthless——大部分 premium 拿到的都是最差的税务处理。
剩下 25-30% 被 assign 的 put 有一点点税务上的好处:premium 会从买入成本里扣掉,等于把 STCG income 转换成未来一笔 LTCG 的 lower basis。但这只是部分补偿。
Wheel 在 taxable account 里比纯 buy-and-hold 税务更差,因为 B&H 是一笔最终的 LTCG event,wheel 是每月一次的 STCG events。
放在 IRA 或 401(k) 里这事就消失了。这跟所有 option income 策略的结论都一样:在税务优惠账户里跑。
Wheel 的真实风险——什么时候要破规矩
机械 wheel(永远按时机重新写)有一个已知的死亡模式:在下跌趋势里被 assign。你在 $100 strike 买入了,然后股票继续跌到 $70。你写了一个 $75 strike 的 call 试图收 premium,结果股价反弹到 $80 把你 cap 在那里——你亏了 25%,还把反弹给让出去了。
如果你真要跑 wheel,事先写下停止规则:
- 下跌 15% 以下你的 put strike 就退出 wheel。承认亏损,撤退,等更好的入场。
- 不要把 call roll down 追 premium。在下跌股票上把 call strike 改低等于锁死了你的反弹。
- 连续被 assign 3 次后减仓。这是 underlying 在持续往不利方向走的信号,不是均值回归。
这些规则不在 backtest 里。一个有风控的 wheel 可能能比机械版多 2-3 个百分点 CAGR——但还是跑不赢 covered call。
我会怎么操作
- 不要把 wheel 当 SPY 主策略。要长期 SPY 暴露就直接持有,或者跑简单 covered call。
- 要做 wheel 必须用 2% OTM strike。这是唯一一个 CAGR 还过得去(10%+)、Sharpe 还能看(0.71)的版本。5-10% OTM 是在用现金回报换手续费。
- Put-sell-as-limit-order 是合法的 entry trick——你想低价买入 SPY 时用这个一次性战术,不要当 wheel。
- 如果要跑 wheel,跑在分红股上,不要跑 SPY。机会成本不一样,数学才会变得合理。
- 必须在 tax-advantaged account 里跑。Taxable 账户里 STCG 把 alpha 全吃掉。
- 预设好停止规则。下跌 15% 退出,连续 assign 3 次减仓。写在纸上。
- 不要用“99% 胜率”说服自己或别人。用多年 CAGR vs 纯持 SPY 来评判。
- 对 SPY 这个特定 underlying,5% OTM 月度 covered call 才是正解——每一个 wheel 配置、每一个起始年份都被它打趴下。
一些技术细节
- Backtest 假设 frictionless。每个 wheel 一年大约 6-12 个 contract trades。Slippage + commission 一年大约 10 bps——对最底层 CAGR 2-3% 的几个变种是有影响的,但不会改变排名。
- Black-Scholes + VIX 对 SPY 够准。放到单股 wheel 上要用单股自己的 IV,不能用 VIX。
- 只测了 SPY。多 underlying 的 wheel basket(SPY + QQQ + IWM)可能因为 imperfect correlation 表现略好——没测过。
- 固定 OTM% 没测动态 OTM。比如根据 IV percentile 决定写得多远——可能进一步改善 premium 捕获。
- 没建模 “active roll”。真实跑 wheel 的人会在 call 还有 50% premium 时提前 roll 出去锁定利润。机械 backtest 让所有合约持有到期。Active management 可能多 50-100 bps/yr。
- 买 put 那一段没有专门 backtest,是定性讨论,结论基于一般 option 理论 + industry 共识。
文件
experiments/exp_38_long_history_wheel.py-
summary.csv— 33 年全周期 CAGR / Sharpe / MaxDD -
phase_split.csv— 每个变种持股天数 vs 现金天数 -
windowed_perf.csv— 1-5 年 rolling 分布 -
recent_starts.csv— 起始 2019-2024 各窗口 -
plots/equity_curves.png— 全部变种 equity 曲线 -
plots/phase_split.png— 持股时间比例 -
plots/win_rate_vs_wealth.png— vanity metric 图
English
There’s a YouTube channel that teaches “the wheel” strategy every week: sell a cash-secured put on SPY (S&P 500 ETF — “cash-secured” means you lock up strike × 100 dollars as collateral, so if the put gets exercised you have the cash to buy the shares); hope it doesn’t get assigned (assigned = forced to buy at the strike because price fell below it). If it does, you take the shares and sell a covered call against them (covered call = holding shares + selling a call to cap upside in exchange for premium). Cycle forever. 99 % of the individual trades are profitable, and the host puts that number on every thumbnail. It looks unbeatable.
I ran the numbers across 33 years of SPY data and across every recent 1-5 year window. Here’s what 99 % per-trade success actually pays, and why this shouldn’t be your SPY strategy.
The short version
Someone who started “the wheel” on SPY in January 2024 — using the 10 % OTM strike that produces the 99 % win rate — has earned 0.4 % a year for 2.4 years. About the same as a money-market fund. Plain SPY over the same window earned 22 % a year.
Tighten the strike to 5 % OTM and it improves a little — CAGR 5.7 % — still about a quarter of what SPY paid. The most aggressive 2 % OTM gets 11.9 %, still 10 percentage points behind SPY. Every wheel configuration, in every recent start window, underperformed buy-and-hold. That’s the opposite of what the YouTube guru is telling you.
High win rate and total wealth are not the same thing. One chart below will end the debate.
One paragraph on the mechanism
Step 1: you start with cash. You sell a cash-secured put on SPY — strike 5 % below the current price, monthly expiration — and lock up strike × 100 dollars as collateral. The buyer pays you a premium up front. At expiration, either SPY closes above the strike (put expires worthless, you keep premium and cash) or it doesn’t (you’re assigned, forced to buy 100 shares at the strike).
Step 2: now you own shares. You sell a covered call — strike 5 % above current price, monthly. At expiration either SPY stays below (call worthless, you keep premium and shares) or it rises through (call assigned, shares get called away at strike, back to cash).
Back to step 1. Round and round. Hence the wheel. Phase A you’re in cash selling puts; Phase B you’re in stock selling calls. The marketing pitch: every trade either expires worthless (you keep the premium) or assigns (you got the position you wanted anyway). Sounds bulletproof.
What we tested
Eight wheel variants plus a plain covered call plus buy-and-hold. Strike distances at 2 / 5 / 7 / 10 % OTM. Also VIX-gated versions (only sell puts when VIX exceeds 15, 20, or 25). Monthly cycle, January 1993 through May 2026, 33 years of SPY data including dot-com, the GFC, COVID, and the 2022 hiking cycle. Premiums priced via Black-Scholes with VIX as the implied vol — for SPY that’s within ~10 % of market mids.
What the last 1-5 years actually paid
Starting January 1 of each year, holding to today:
| Started | Years | Plain SPY | CC 5 % | Wheel 2 % | Wheel 5 % | Wheel 10 % |
|---|---|---|---|---|---|---|
| 2019 | 7.4 | 17.6 % | 14.5 % | 9.7 % | 6.5 % | 2.7 % |
| 2020 | 6.4 | 15.5 % | 13.7 % | 9.7 % | 5.9 % | 3.1 % |
| 2021 | 5.4 | 15.5 % | 13.6 % | 9.5 % | 5.7 % | 1.2 % |
| 2022 | 4.4 | 12.1 % | 10.6 % | 7.7 % | 5.3 % | 1.1 % |
| 2023 | 3.4 | 23.5 % | 17.0 % | 12.3 % | 6.7 % | 0.4 % |
| 2024 | 2.4 | 22.5 % | 17.7 % | 11.9 % | 5.7 % | 0.4 % |
Three things from the table:
1. Plain SPY won on CAGR in every start window — by anywhere from 8 percentage points (vs wheel-2%) to 22 percentage points (vs wheel-10%).
2. Covered call (permanently long shares, sell a call each month) beat every wheel variant in every window. Same instrument (SPY + monthly options), simpler structure, better outcome. If you’ve decided you want a SPY income strategy, use covered call instead of the wheel.
3. Wheel-10% from 2024 paid 0.4% CAGR — barely above cash. Reason: 10 %-OTM puts almost never get assigned in a steady bull market, so the position sits in cash collecting thin premium while SPY rips. That’s the wheel’s worst case fully expressed.
The drawdown column is where the wheel finally has an advantage:
| Started | SPY MaxDD | CC MaxDD | Wheel 5 % MaxDD | Wheel 10 % MaxDD |
|---|---|---|---|---|
| 2019 | −34 % | −21 % | −28 % | −5 % |
| 2022 | −25 % | −12 % | −16 % | 0 % |
| 2024 | −19 % | −12 % | −12 % | 0 % |
Wheel-10% over 2.4 years had zero drawdown. The cost was 0.4 % CAGR. That is the wheel’s actual product: insurance-grade smoothness, at insurance-company-profit-margin returns.
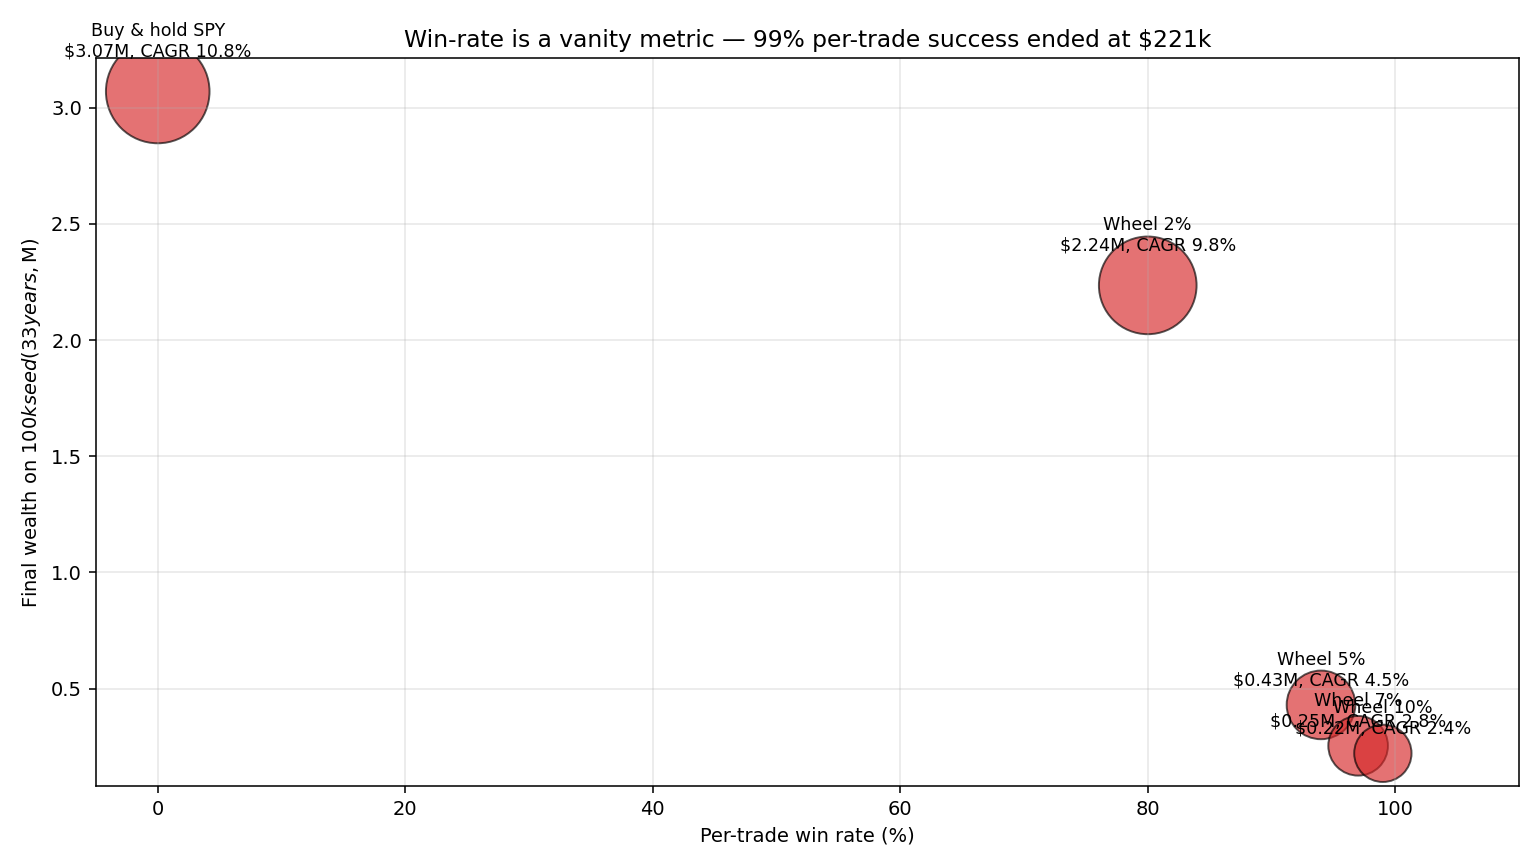
The vanity-metric trap — one chart to end the debate
Plot per-trade win rate against final wealth across the 33-year backtest:
| Variant | Puts sold | Put win rate | Calls sold | Call win rate |
|---|---|---|---|---|
| Wheel 2 % | 275 | 80 % | 125 | 55 % |
| Wheel 5 % | 333 | 94 % | 67 | 70 % |
| Wheel 7 % | 370 | 97 % | 30 | 63 % |
| Wheel 10 % | 271 | 99 % | 129 | 98 % |
Wheel-10% sold 271 puts in 33 years. Only 2 ever assigned. Sold 129 calls, only 2 ever assigned. Basically every trade was a winner.
Final account value: $221,000 (starting from $100k).
Plain SPY over the same window: $3,070,000.
A 14× shortfall.
That’s what “win rate is a vanity metric” means. A coin flip that pays $1 on heads, loses $100 on tails — 50 % win rate, catastrophic expected value. Wheel-10% is the option-income version: trades almost always win, but each win is so small the strategy can’t keep up with cash, let alone equities.
Total wealth at the end is the metric. Win rate is not.
If anyone is selling you a wheel strategy and leads with “99 % win rate,” ask for the multi-year CAGR comparison versus plain buy-and-hold. If they won’t show it, they’re either innumerate or counting on yours.
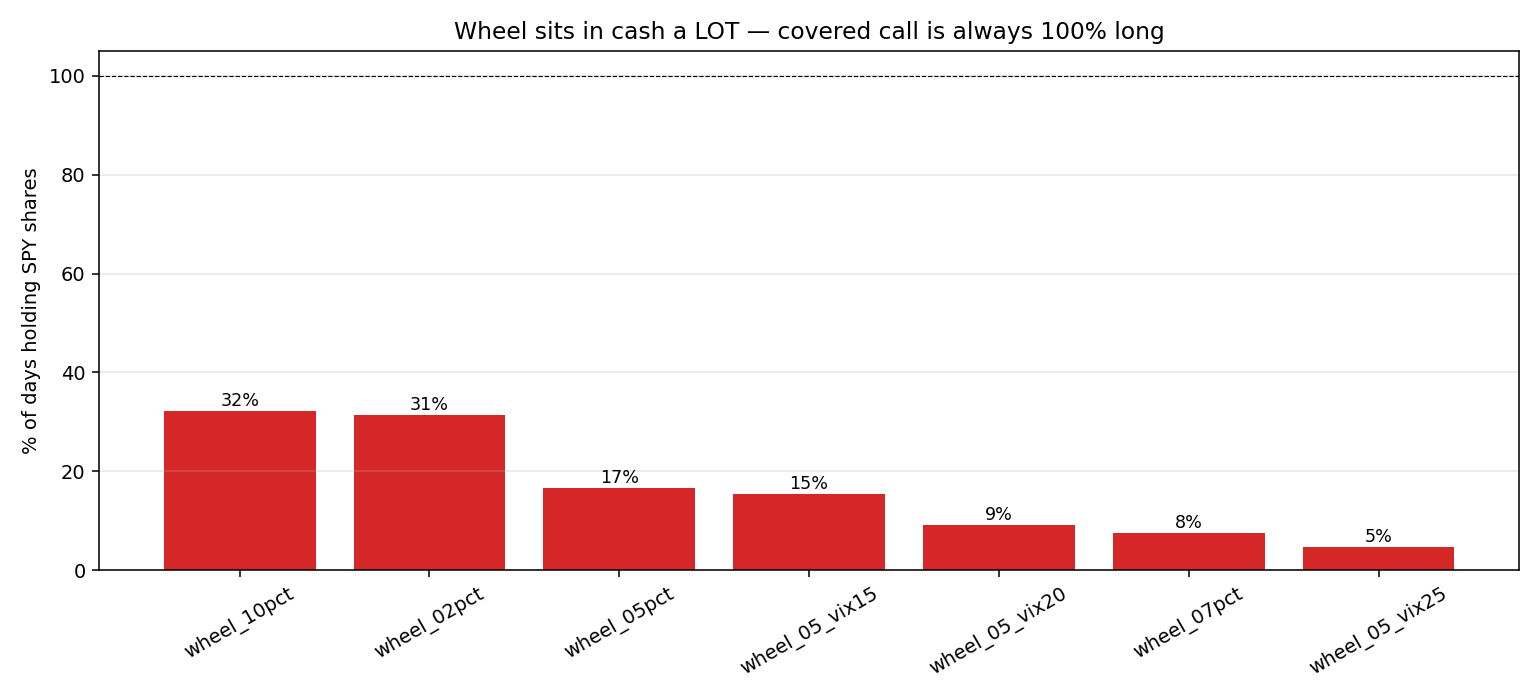
How much time the wheel actually spends doing nothing
The cleanest angle is to look at daily position state:
| Variant | Days in shares | Days in cash |
|---|---|---|
| Covered call | 100 % | 0 % |
| Wheel 2 % | 31 % | 69 % |
| Wheel 5 % | 17 % | 83 % |
| Wheel 7 % | 8 % | 92 % |
| Wheel 10 % | 32 % | 68 % |
The canonical 5 %-OTM wheel sits in cash 83 % of the time. SPY earns ~10 %/year. Cash earns ~5 %. Premium adds 3-4 %. Math: you’re getting 5+3 = 8 % during 83 % of days, plus full 10 % during 17 % — weighted average comes out under 9 %. That’s why it can’t catch SPY.
(Wheel-10% at 32 % in shares is an anomaly. When the rare 10 %-OTM put does assign, the corresponding 10 %-OTM call almost never assigns either, so you sit long for ages collecting essentially zero premium. That’s another way to lose.)
When the wheel actually makes sense
The 7-22 point CAGR gap condemns the wheel as a primary long-term strategy. But three specific use cases survive:
Use case 1: as an entry maneuver, not a strategy. You want to buy SPY at $440 when it’s at $460. Instead of a limit order at $440, sell a 30-day put with $440 strike. If SPY drops to $440, you’re assigned — same outcome as the limit order, except you collected premium for the wait. If not, you keep the premium and try again next month. This is not the wheel — it’s a put-sell-as-limit-order, a one-time entry tactic. The CAGR gap doesn’t apply because the comparison isn’t “wheel forever,” it’s “wait at $440.”
Use case 2: on dividend stocks you want to own long-term, not on SPY. The wheel’s cash phase is wasted on SPY because SPY’s normal rate of return is the opportunity cost. On dividend payers (KO, JNJ, VZ) or cyclicals at a low (XOM after an oil crash, BAC after a banking scare), the wheel’s structure makes more sense. Premium on those names is often richer than SPY, and the cash phase replaces a portion of your bond allocation rather than your equity allocation. Different opportunity cost, different math.
Use case 3: as part of your fixed-income sleeve. If you’d otherwise hold cash or short bonds, replacing some of that with cash-secured puts on stocks you’d own anyway converts a 4 % cash return into 6-8 % premium-plus-cash. The comparison is cash, not equity. The wheel beats cash. It does not beat equity.
Outside these three, the wheel is a strategy in search of a use — marketed as an equity substitute when it isn’t one.
Flipping it: what about buying puts?
Natural follow-up: if selling puts on SPY has worked this poorly, what about buying puts?
Framing first: selling a cash-secured put is short volatility — you’re betting SPY won’t drop through your strike. Buying a put is long volatility / directional short — you’re betting SPY drops, or buying downside insurance on a position.
Three mainstream long-put setups:
- Protective puts. You hold SPY and buy an OTM put to cap the downside. Pay premium to insure your position. Cost: roughly 1-3 % of portfolio per year in premium, dragging CAGR; benefit: MaxDD floored at the put strike. Long-term backtest result: cost exceeds benefit. The academic consensus is “persistent protective put underperforms naked long over the long run.” But for known event windows (earnings, Fed decisions), short-term protective puts are reasonable tactical tools.
- Short-DTE long puts as speculation. You think SPY drops, buy near-month puts. Theta decay is fast, expected return is clearly negative. Mirror image of “buying calls as lottery tickets.” Don’t run this as a strategy.
- Put spreads (buy a closer put, sell a further put). Defined maximum profit and loss. Cheaper than naked long put. Right tool when you have a view like “I think SPY drops, but not below $YYY.”
Does VIX timing help buying puts? Counterintuitively, often no. High VIX usually means the market is already falling — implied vol is bid up, so you buy expensive puts. Low VIX means the market is rising — cheap puts, but why would you want downside insurance when nothing’s wrong? The natural pairing of “buy puts cheaply” and “actually need them” rarely happens. That’s the put-buyer’s timing problem.
Plain answer: most retail investors should not have long puts as a strategy. Long-term bullish SPY → just hold it. Worried about specific events → use put spreads to cap cost. Genuinely think SPY is about to crash → reduce your SPY position. Selling stock has no theta. Buying puts does.
Taxes are a bigger deal than people admit
Every premium the wheel collects in a taxable account is short-term capital gains, taxed as ordinary income. About 70 % of CSPs expire worthless — so most of the premium gets the worst possible tax treatment.
The remaining 25-30 % that assign do have a small tax benefit: the premium reduces your cost basis on the resulting share position, effectively converting STCG income into a lower LTCG basis later. Partial offset only.
Net: the wheel is less tax-efficient than plain buy-and-hold in a taxable account because B&H is one eventual LTCG event while the wheel sprays STCG events monthly.
In an IRA or 401(k), this difference disappears. Same conclusion as every other option-income strategy: run it in a tax-advantaged account.
The wheel’s real risk — when to break the rules
The mechanical wheel (always re-write at expiry) has a known failure mode: getting assigned during a downtrend. You bought at $100 (your CSP strike), stock keeps falling to $70. You sell a $75 call trying to collect premium, then the stock rebounds to $80 and your call gets assigned. You lost 25 % and gave up the recovery.
If you’re actually going to run this strategy, write the stop rules before the first trade:
- Stop the wheel if the underlying drops 15 % below your CSP strike. Take the loss, exit, wait for a better setup.
- Don’t roll the call down to chase premium. Lowering the strike on a falling stock guarantees you cap your recovery.
- Reduce position size after 3 consecutive assignments. That’s a signal the underlying is trending against you, not mean-reverting.
These rules are not in the backtest. A risk-managed wheel might recover 2-3 percentage points of CAGR over the mechanical version. Still wouldn’t beat covered call.
What I would actually do
- Don’t use the wheel as a primary SPY strategy. For long SPY exposure, just hold SPY or run a simple covered call.
- If you must wheel, use 2 % OTM. It’s the only variant with reasonable CAGR (10 %+) and Sharpe (0.71). 5-10 % OTM is trading cash returns for fees.
- Put-sell-as-limit-order is a legitimate entry trick — one-time tactic when you want to buy lower. Not the wheel.
- Wheel on dividend stocks, not SPY. The opportunity cost calculation changes when the cash phase replaces fixed income instead of equity.
- Tax-advantaged account only. STCG eats too much of the return otherwise.
- Pre-commit to stop rules. Drop 15 % from CSP → exit. Three consecutive assignments → cut size. Write it down.
- Don’t use “99 % win rate” to convince yourself or anyone else. Use multi-year CAGR vs plain SPY.
- For SPY specifically, a 5 % OTM monthly covered call dominates every wheel variant in every recent window we tested.
Boring stuff
- Backtest assumes frictionless execution. Each variant trades 6-12 contracts a year. Real-world slippage + commission runs about 10 bps a year — material to the worst variants (2-3 % CAGR) but doesn’t flip rankings.
- Black-Scholes with VIX is accurate enough for SPY. A wheel on single stocks would need per-name IV, not VIX.
- Only tested on SPY. A multi-underlying wheel basket (SPY + QQQ + IWM) might benefit from imperfect cross-correlations — untested here.
- Static OTM percentage. A dynamic OTM rule (e.g., based on current IV percentile) might capture more premium — untested.
- No active roll management modeled. Real wheel runners close a winning call at 50 % premium captured, rather than holding to expiry. Active management probably adds 50-100 bps/yr.
- The long-put discussion is qualitative — based on standard option theory and industry consensus, not a dedicated backtest.
Files
experiments/exp_38_long_history_wheel.py-
summary.csv— 33-year CAGR / Sharpe / MaxDD per variant. -
phase_split.csv— days in shares vs cash per variant. -
windowed_perf.csv— rolling 1-5y distributions. -
recent_starts.csv— CAGR/MaxDD by start year 2019-2024. -
plots/equity_curves.png— all variants overlaid. -
plots/phase_split.png— share/cash time fractions. -
plots/win_rate_vs_wealth.png— the vanity-metric chart.