QUANT · MAY 2026
你的 60/40 应该用什么资产
What should the 40% in 60/40 actually be?
中文
2022 年发生了一件理论上不该发生的事:标准 60/40(60/40 是过去几十年退休账户的默认资产配置——60% 股票 + 40% 债券;这里具体跑的是 60% SPY = S&P 500 指数 ETF + 40% 长期国债 TLT = iShares 20+ Year Treasury ETF)一年跌了 23%,比纯持 SPY 还多跌 4 个点。债券原本是放在那儿给股票崩盘兜底的“保险腿”,赔得比“主险”还狠。
机制其实不复杂——通胀冲到 9%,Fed 一年从 0% 把利率拉到 5%,股票跌(未来现金流折现更重)+ 长债跌(票息折现率突然跳高),两个理论上无关的资产被通胀变成正相关。但这是过去 40 年里第一次。“60/40 + 长债”是这几十年里退休账户的默认答案,2022 之前没人觉得这有什么问题。一个退休年龄的人在 2022 看到自己的“稳健配置”跌得比纯股票还狠,是一件很难消化的事。
那之后的自然问题:如果债券不再是合适的对冲,那 40% 应该放什么?
我跑了 13 个候选——各种期限的国债、宽基债券指数、黄金、白银、宽基商品、原油、低波动股票、equal-weight 标普、加密代理、SPY 反向 ETF。对比 17 年 (2009-2026) 的数据,再细看每个起始年份开始持有到今天的实际收益。
短答
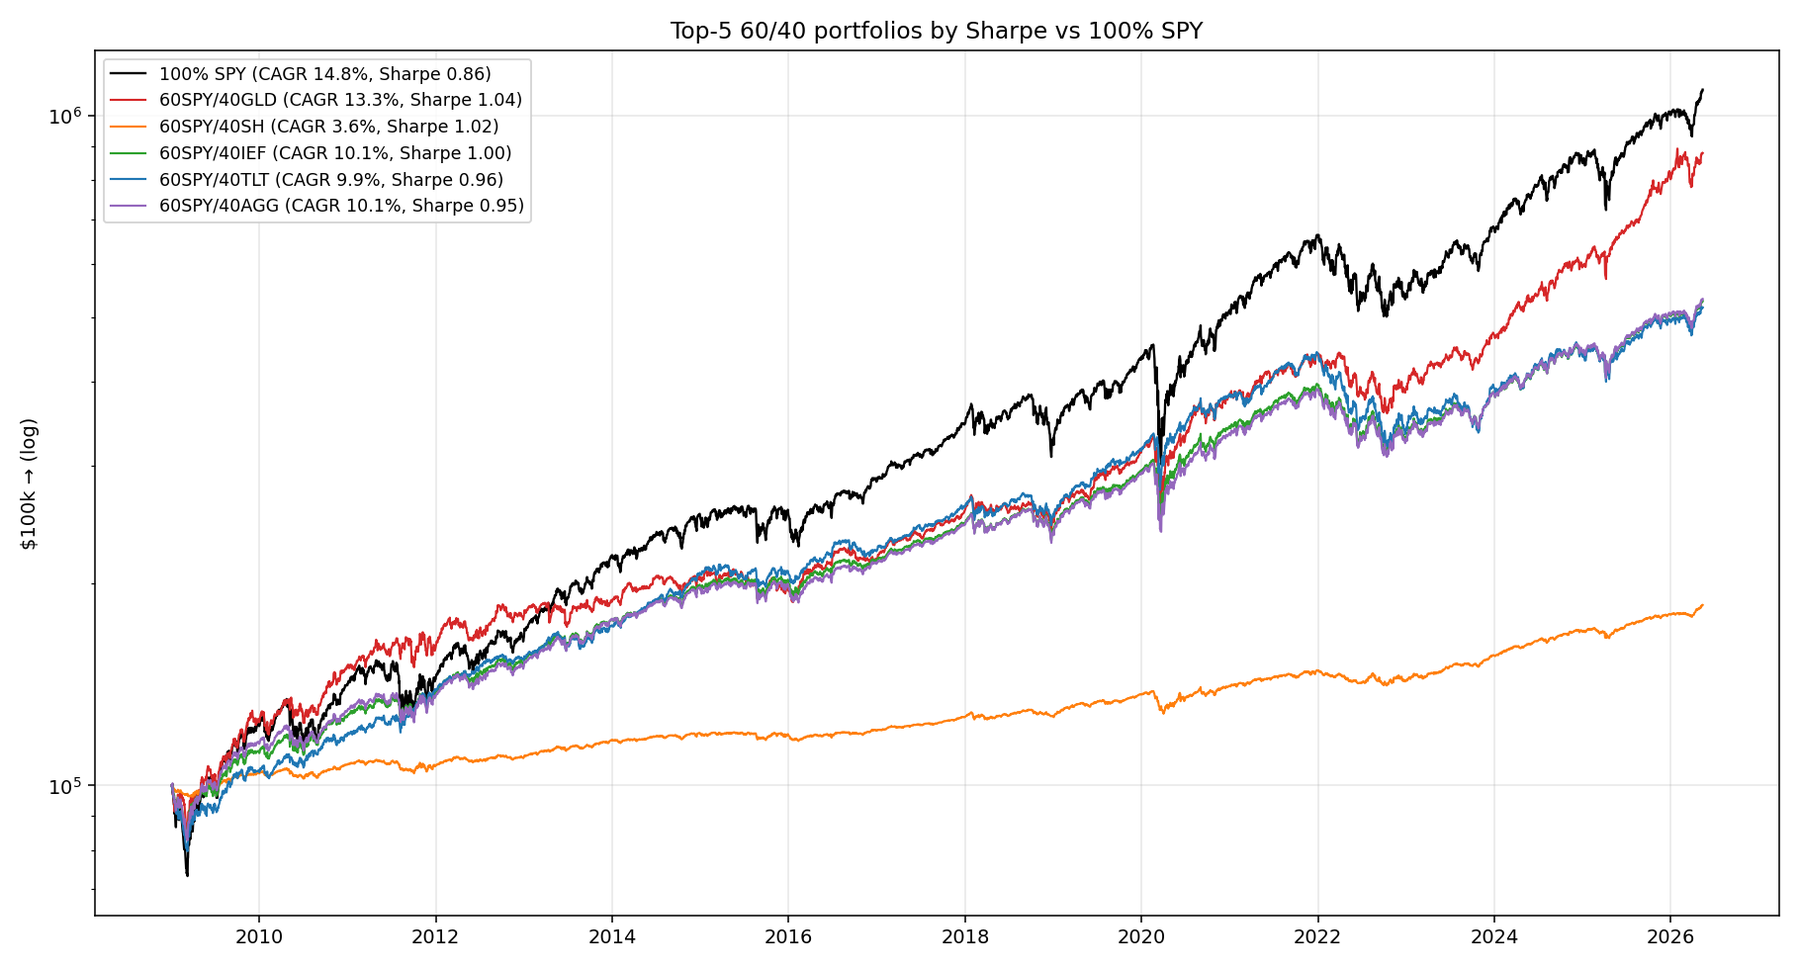
起始 2019 年的 60/40 + 黄金 (60% SPY + 40% GLD),到今天的 CAGR 是 18.6%。同期 60/40 + 长债 (TLT) 只有 10.1%。100% 纯 SPY 是 17.6%。
读这句话三遍。黄金做的 60/40 不仅打赢了债券做的 60/40,还打赢了 100% 纯股票,同时 MaxDD 比 100% SPY 浅 34%(−22% vs −34%)。这是这个 repo 里“diversification 真的有用”最干净的证据——但具体生效的是黄金,不是债券。
几个关键术语
- CAGR — 年化复合收益率
- MaxDD — 历史最大回撤(亏损最严重时账户从峰值跌到谷值的比例)
- Sharpe ratio — 单位波动下的收益。1 以上算好
- Correlation with SPY — 跟股票的相关系数。接近 0 或负数才是好对冲;接近 +1 等于跟股票一起涨跌,没起到分散作用
- Sequence-of-returns risk — 回撤的时间顺序对正在取钱的退休者杀伤力比中位数收益还大。同样平均年化,但坏年份排在退休第 1 年 vs 第 30 年,账户能存活的概率完全不同
13 个候选都是啥
简单介绍下,这些名字你在 Bogleheads / 雪球上肯定见过:
- TLT (iShares 20+ Year Treasury Bond ETF)。长期美国国债。Duration 大约 17 年。Expense ratio 0.15%。教科书 60/40 的默认。问题:duration 越长,对利率变动越敏感——2022 年 Fed 加息它就成了风险放大器而不是对冲。
- IEF (iShares 7-10 Year Treasury Bond ETF)。中期国债。Duration 约 7 年。Expense 0.15%。比 TLT 受加息的伤小很多——2022 年只跌 15%,TLT 跌 31%。
- SHY (iShares 1-3 Year Treasury Bond ETF)。短期国债。Duration 约 2 年。Expense 0.15%。基本等同于现金 + 一点点 carry。在加息周期里几乎没有 duration risk。
- AGG (iShares Core US Aggregate Bond ETF)。宽基美债——国债 + 投资级公司债 + MBS 的加权。Duration 6-7 年。Expense 0.03%。最便宜的“全债券暴露”。
- GLD (SPDR Gold Shares)。黄金 ETF,仓库里真有金条。Expense 0.40%(黄金 ETF 里中等贵的)。最大的非债券、非股票资产之一,AUM ~$80B。唯一在通胀崩盘和通缩崩盘里都能保值的资产。
- SLV (iShares Silver Trust)。白银 ETF。波动比黄金大很多,工业属性更强(半导体、太阳能)。跟黄金相关性高但 beta 高 1.5-2 倍。
- DBC (Invesco DB Commodity Index Tracking Fund)。宽基商品 — 原油、能源、工业金属、农产品的加权。Expense 0.85%。复杂的 K-1 税务表。
- USO (United States Oil Fund)。WTI 原油的代理(用近月期货 roll,所以会有 contango drag)。Expense 0.79%。极度波动。
- MSTR (MicroStrategy) — 我们没有干净的长历史 BTC 数据,所以拿 MSTR 这家公司当 BTC 代理(它的资产大部分是 BTC)。注意:MSTR 不是纯 BTC,它的股价波动比 BTC 还大(2022 年它跌 75% 时 BTC 跌 65%)。
- USMV / SPLV (iShares MSCI USA Min Vol / Invesco S&P 500 Low Volatility)。两个低波动股票 ETF——挑波动最低的几十只标普成分股加权持有。Expense 各 0.15% / 0.25%。
- RSP (Invesco S&P 500 Equal Weight ETF)。把 500 只标普成分股等权重持有(不是按市值),所以小市值的占比比 SPY 大。Expense 0.20%。
- SH (ProShares Short S&P 500)。-1× SPY 的反向 ETF。Daily reset——长期持有有结构性损耗(在牛市里会慢慢漏血)。
Backtest 结构
每个候选都跑 60% SPY + 40% 该资产,每季度 rebalance 回到目标权重。窗口:2009-01 到 2026-05(17 年)。每对起始时间取 max(2009-01, 候选 ETF 上市日)。
17 年总排名(按 Sharpe)
| 组合 | CAGR | Sharpe | MaxDD | Calmar | SPY 相关性 | $100k → |
|---|---|---|---|---|---|---|
| 60/40 GLD | 13.3% | 1.04 | −22% | 0.60 | 0.06 | $877k |
| 60/40 SH | 3.6% | 1.02 | −7% | 0.49 | −1.00 | $186k |
| 60/40 IEF | 10.1% | 1.00 | −21% | 0.47 | −0.26 | $528k |
| 60/40 TLT | 9.9% | 0.96 | −28% | 0.36 | −0.29 | $517k |
| 60/40 AGG | 10.1% | 0.95 | −21% | 0.48 | 0.00 | $532k |
| 60/40 USMV | 13.8% | 0.94 | −33% | 0.41 | 0.89 | $657k |
| 60/40 SHY | 9.6% | 0.93 | −20% | 0.49 | −0.13 | $490k |
| 100% SPY | 14.8% | 0.86 | −34% | 0.44 | 1.00 | $1.09M |
| 60/40 MSTR | 23.7% | 0.82 | −59% | 0.40 | 0.42 | $4.0M |
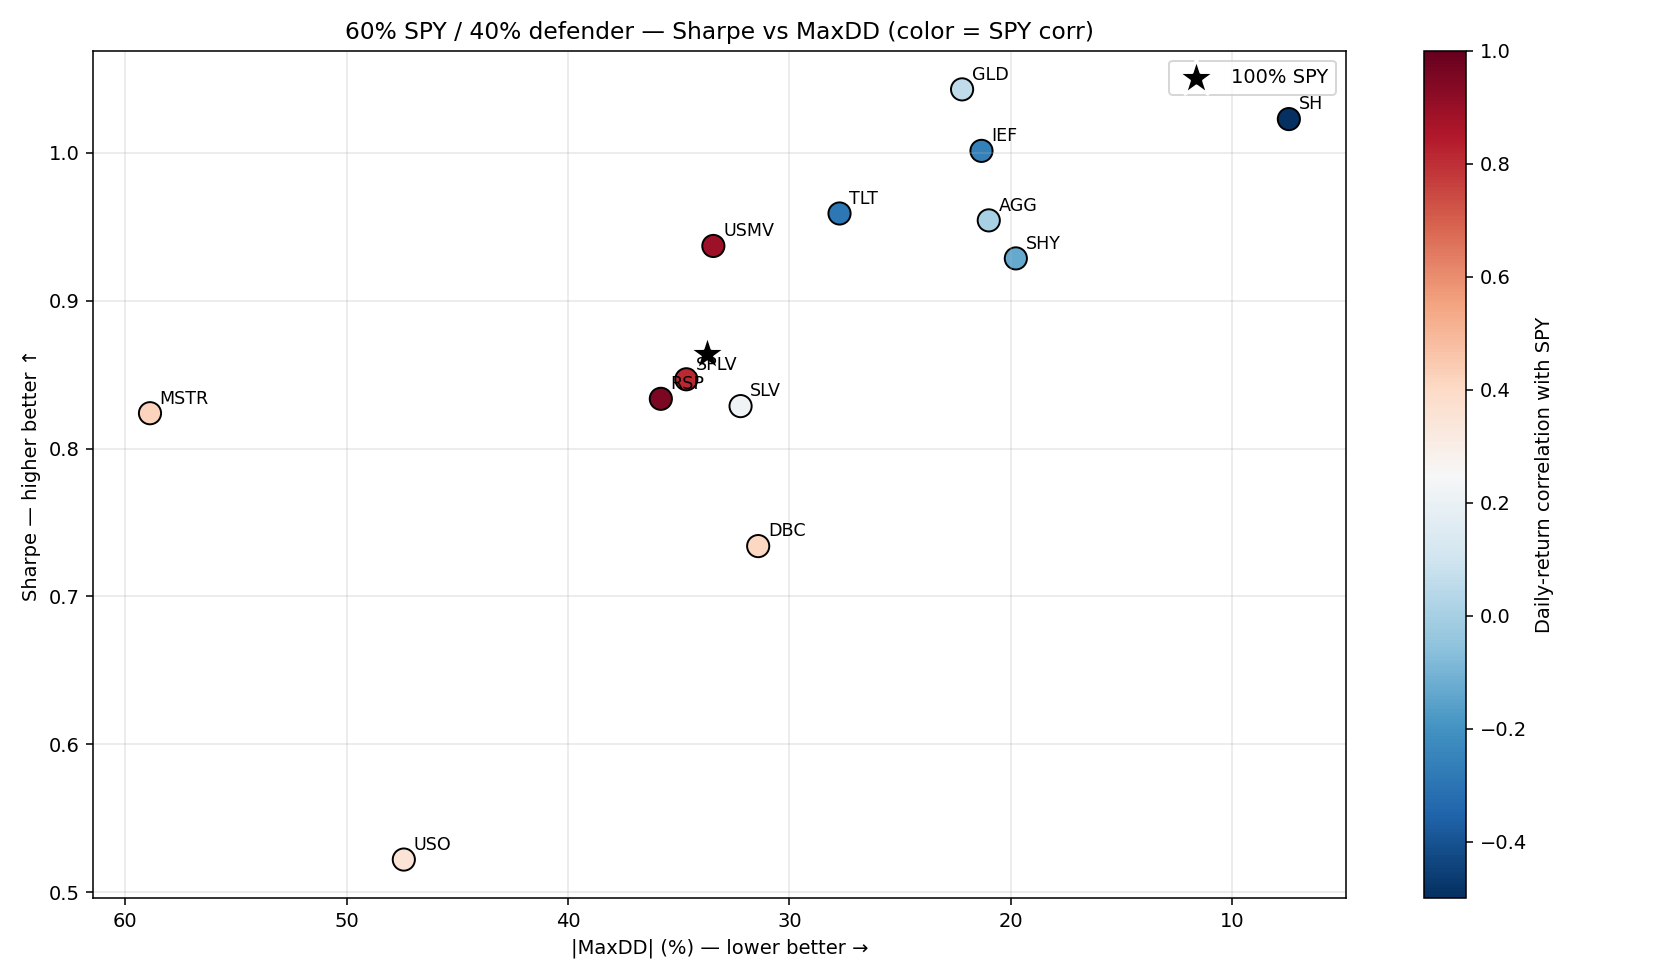
注意三个排序:
- 60/40 GLD 在每个 metric 上都打赢 60/40 TLT——Sharpe (1.04 vs 0.96)、MaxDD (−22% vs −28%)、CAGR (13.3% vs 9.9%)、Calmar (0.60 vs 0.36)。黄金跟 SPY 的相关性 (0.06) 接近 0,比 TLT 的 (−0.29) 在不同 regime 下都稳定——TLT 在通缩里负相关、在通胀里正相关,不可靠。
- Sharpe 1.0+ 的 tier 是 GLD、SH、IEF——黄金、SPY 反向、中期国债。教科书的 TLT 长债不在第一梯队。
- 100% SPY 在 Sharpe 上打赢 6 个 60/40 配置。教科书“加债券改善 risk-adjusted return”只在 GLD、SH、IEF、AGG、USMV、SHY 上对——而真正 Sharpe 跟 MaxDD 都赢 SPY 的只有 GLD。
最近 1-5 年实际赚了多少——关键的一张图
| 起始 | 100% SPY | 60/40 TLT | 60/40 IEF | 60/40 AGG | 60/40 GLD | 60/40 MSTR |
|---|---|---|---|---|---|---|
| 2019 | 17.6% | 10.1% | 11.2% | 11.5% | 18.6% | 37.7% |
| 2020 | 15.5% | 7.9% | 9.6% | 9.8% | 17.4% | 40.0% |
| 2021 | 15.5% | 5.9% | 8.5% | 9.2% | 16.7% | 33.0% |
| 2022 | 12.1% | 3.9% | 6.9% | 7.4% | 17.2% | 32.3% |
| 2023 | 23.5% | 13.4% | 15.1% | 15.6% | 27.2% | 68.6% |
| 2024 | 22.5% | 12.5% | 14.6% | 14.9% | 30.3% | 46.7% |
三件事 internalize:
1. 60/40 GLD 在每一个最近窗口里都打赢 100% SPY。再读一遍。最近 2-7 年,40% 资金放在黄金里 + 60% 在股票里,比 100% 股票赚得还多。回撤还浅:
| 起始 | 100% SPY MaxDD | 60/40 GLD MaxDD |
|---|---|---|
| 2019 | −34% | −22% |
| 2022 | −25% | −19% |
| 2024 | −19% | −12% |
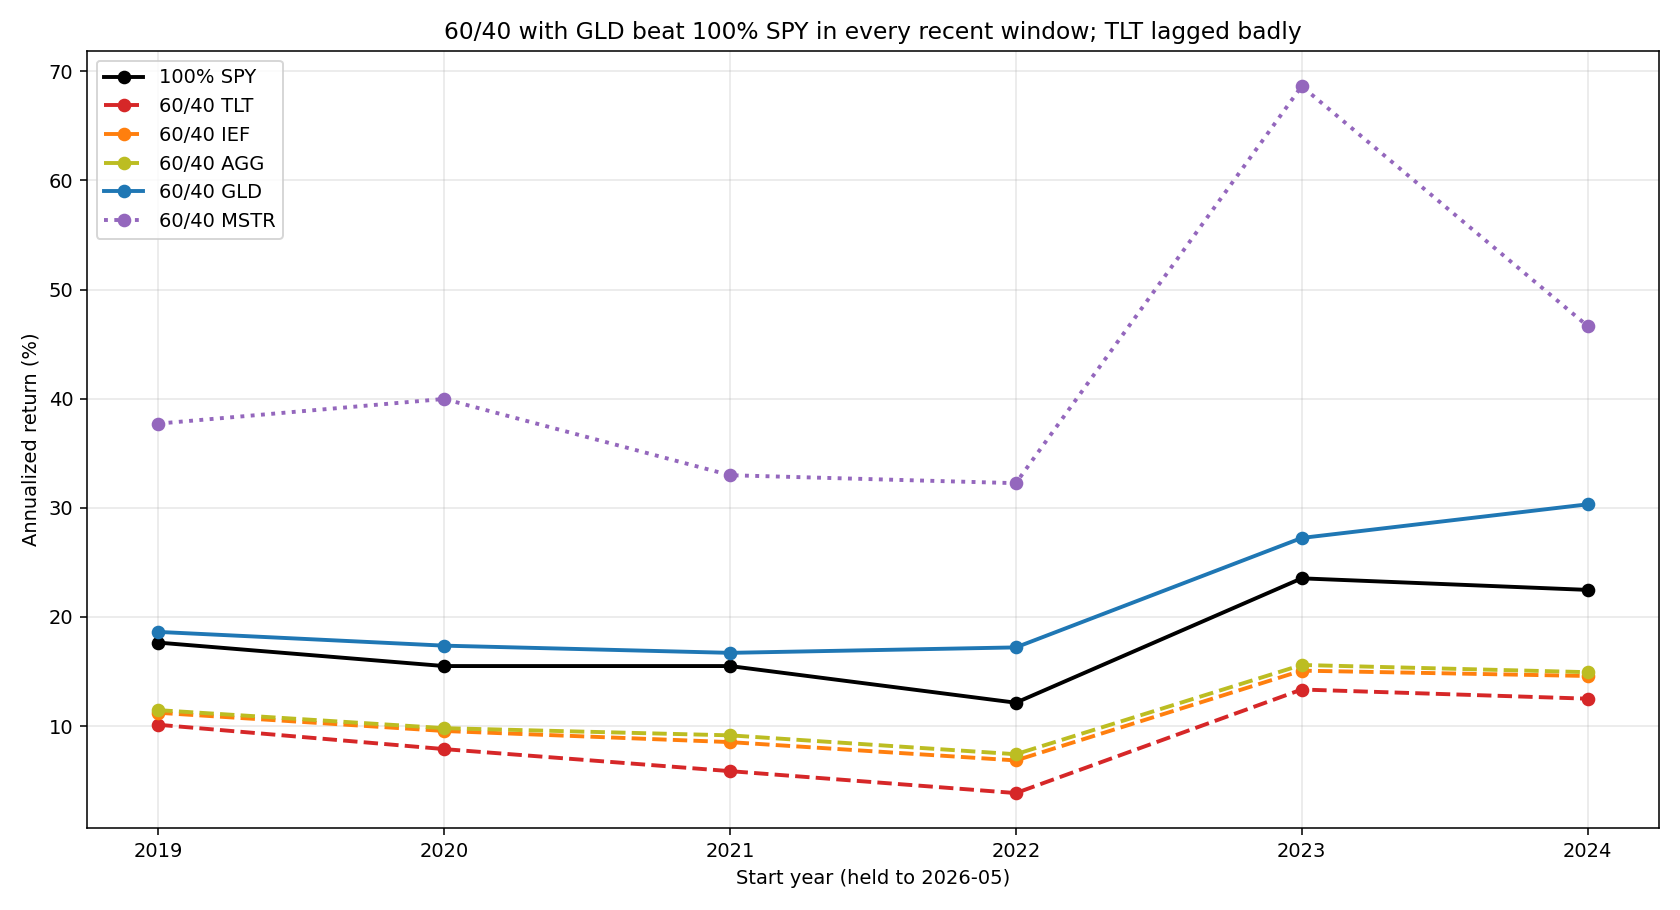
2. 60/40 TLT 每个最近窗口都比 100% SPY 跑输 5-10 个百分点。Diversification 的“成本”在最近 5 年是巨大的。起始 2022 的 60/40 TLT CAGR 3.9%——同期现金 ~5%。“安全”配置跑输现金。
3. 黄金过去 3 年的涨势非常猛。起始 2024 的 60/40 GLD 在 2.4 年里涨了 87%——央行购买、地缘政治、美元忧虑同时发生。这不代表未来会一直这样。要看长期可预期回报,看 17 年那张总排名表。
2022 — 诊断年
光看汇总不够直观。看 2022 这一年单独发生了什么:
| 组合 | 2022 MaxDD | 2022 总回报 |
|---|---|---|
| 60/40 MSTR | −43% | −42% |
| 60/40 TLT | −27% | −23% |
| 100% SPY | −25% | −19% |
| 60/40 AGG | −21% | −16% |
| 60/40 IEF | −21% | −17% |
| 60/40 USO | −20% | +0.1% |
| 60/40 GLD | −19% | −11% |
| 60/40 DBC | −17% | −4% |
| 60/40 SH | −5% | −3% |
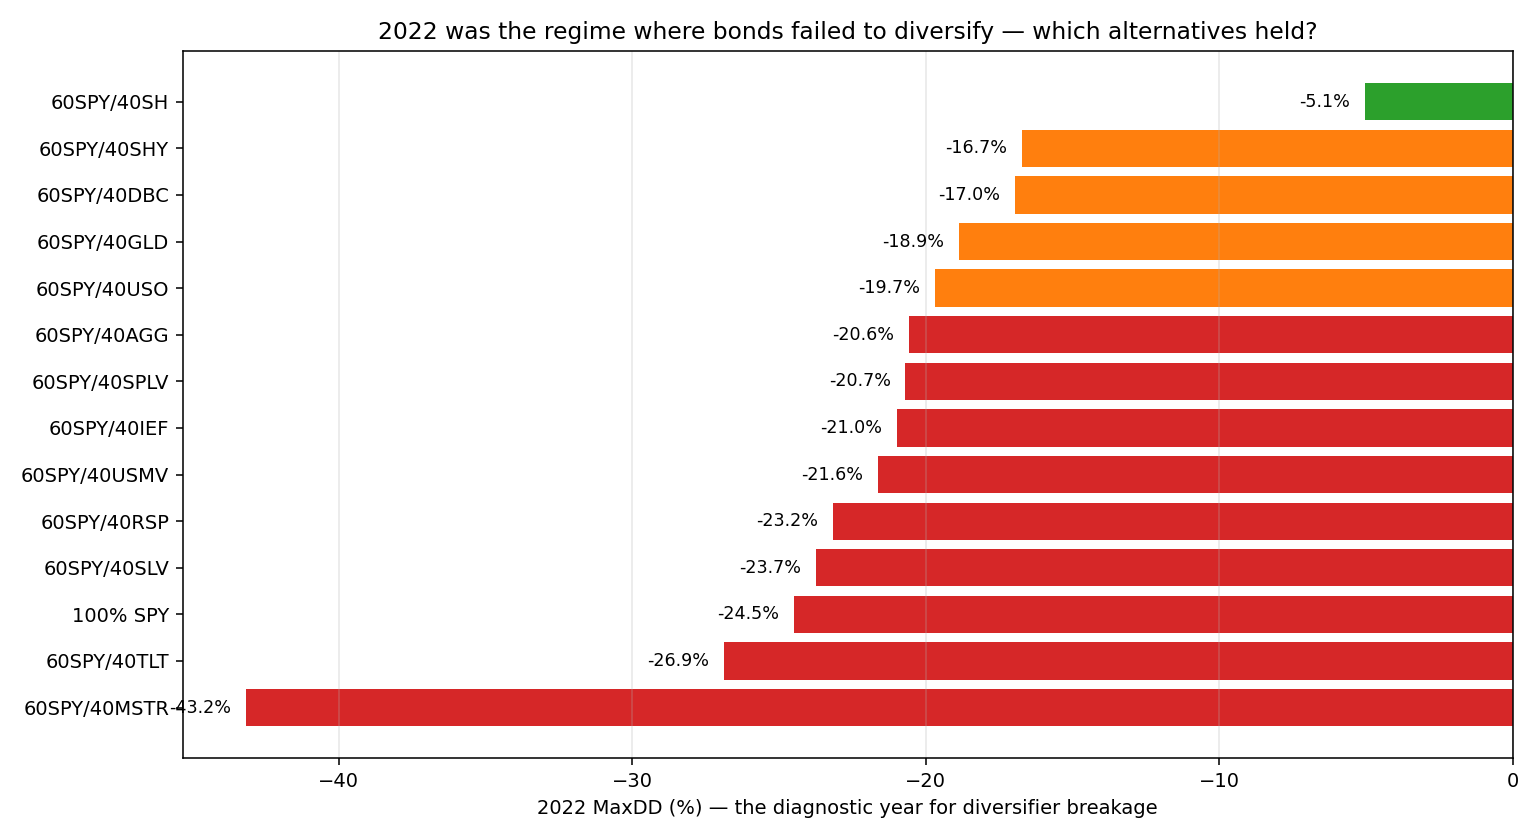
骇人的事实:60/40 长债组合在 2022 比 100% SPY 跌得还多。教科书的“保险”变成了风险放大器。任何一个跑标准 60/40 TLT 的退休者在 2022 比纯持 SPY 多承担 2 个点的 drawdown,作为“分散化”的对价。
赢家是抗通胀的实物资产:GLD (−19%)、DBC (−17%)、USO 这种正回报。
机制:通胀冲击 + Fed 暴力加息时,股票跌(未来现金流折现更重)+ 长债跌(票息折现率突然跳高),两个理论上无关的资产被通胀变成正相关。黄金作为实物资产不依赖于名义利率,对冲机制不被通胀打掉。
为什么黄金行而长债不行
债券跟黄金都被叫“避险资产”,但机制不一样:
- 债券在通缩衰退里有效——衰退、银行危机、新冠那种需求冲击。Fed 降息 → 债券涨 → 对冲生效。
- 黄金在通胀冲击里有效——石油 shock、货币贬值、财政扩张。Fed 加息 → 债券惨跌 → 但黄金涨,因为印钱速度超过挖金速度。
2009-2020 主要是通缩担忧,债券是对的对冲。2022-2025 是通胀冲击,黄金是对的。你不知道下一次危机是哪种类型。同时持两种对冲(一些债券 + 一些黄金)能两边都覆盖;只持债券留下通胀风险敞口。
黄金是这个研究里最接近“全天候对冲”的资产——通缩崩盘 (保值) 和通胀冲击 (实物资产) 都能起作用。
Sharpe vs CAGR — 看你年龄
表格在不同 metric 下讲不同故事:
25-50 岁、还在积累阶段(每月往退休账户里投钱)——CAGR 更重要。100% SPY 跑赢 60/40 GLD 一点点 CAGR,但 30 年下来终值差 30%。你 30 年里能承受 −34% 的 drawdown,因为你还有 30 年时间恢复。
50-65 岁、接近提取阶段——Sharpe 更重要。退休第 1 年 −35% 的回撤是灾难性的,因为你正好在低点卖股票补生活费。60/40 GLD 浅一半的 drawdown 正好是让你 withdrawal plan 能撑下去的保险。
这就是sequence-of-returns risk——回撤的顺序对正在取钱的人比中位数收益还重要。同样 30 年平均回报,但坏年份排在退休第 1 年 vs 第 30 年,账户能不能撑到死活完全不同。
没有单一最优 60/40 替代——取决于你处于积累期还是提取期。
TIPS — 我们漏测的那个
TIPS (Treasury Inflation-Protected Securities) = iShares TIPS Bond ETF (TIP)。本金根据 CPI 调整:通胀 5% 本金涨 5%,再加上 real yield (现在大约 1-2%)。
我们这次没测 TIP 因为它的 ETF 历史略短。但 2022 的压力测试里 TIP 跌 12%——比 TLT (−31%) 和 IEF (−15%) 都好。TIPS 在结构上就是为通胀做的对冲,正好是 60/40 在 2022 出问题的那个环境。
合理推测加上 TIP 后的排名:
- GLD(仍然 Sharpe 最好)
- TIP(清洁的通胀对冲)
- IEF / AGG(中期名义债券)
- TLT(长期名义债券——通胀环境下危险)
加 TIP 进 matrix 是后续 experiment 的候选。
Bitcoin 怎么办?
BTC(或 MSTR 这个代理)经常被宣传为“数字黄金”——uncorrelated store of value。实际数据:
- 正常市场:BTC 跟 SPY 相关性 0.0-0.3,看着像黄金。
- 尾部风险事件:相关性飙到 +1。2020 年 3 月 BTC 两天跌 50%、SPY 跌 34%。2022 Q1 BTC 跌 45%、SPY 跌 10%。
所以 BTC 不是尾部风险对冲。它是个“高 beta 数字暴露”,在平静市场里相关性低、在危机里高度相关。正好是你不希望对冲资产具有的属性。
如果你要 crypto 暴露:合理仓位是 0-5%(return enhancer,不是 defender)。60/35/5 SPY/GLD/BITO 比 60/40 SPY/BITO 合理得多。
另一种“diversification”:杠杆 60/40
值得提一个非标方向——leveraged 60/40。WisdomTree 的 NTSX 这只 ETF 实际上是 90% SPY + 60% Treasury futures(=150% 暴露),每天 rebalance。原理:60/40 用了 100% 的资金跑出 90% 股票暴露 + 60% 债券暴露 = 150% 总暴露,省下来的 100% 用现金抵押。
Pros:跟 60/40 相同的 risk-adjusted return,但 CAGR 接近 100% SPY,因为有 1.5× 总暴露。 Cons:每日 rebalance 有 vol drag(跟杠杆 ETF 是同样的机制);通胀冲击里两条腿同时杠杆放大下跌。
如果你信 60/40 的 Sharpe 优势但又不愿意接受它 CAGR 拖低你的总财富——NTSX 是个有趣的方案。我没在这个 backtest 里测 NTSX,但是把它列出来当一个“非标 60/40”的选项。
税务上各 defender 的差异
| Defender | Taxable account 税务 |
|---|---|
| TLT、IEF | Coupon income 按 ordinary rate 每年计税 |
| GLD | LTCG 是 28%(“collectibles” rate),不是普通 LTCG 的 15-20% |
| DBC | 发 K-1 表,税务复杂 |
| BITO (BTC futures ETF) | 不管持多久都按 60/40 LTCG/STCG 拆分(futures rule) |
| HYSA 现金 | Ordinary income 计利息 |
黄金 28% 的 collectibles 税率在 taxable account 里会吃掉一部分 Sharpe 优势。IRA 或 401(k) 里这事消失。又一次:defender 都应该放在税务优惠账户里。
我会怎么操作
按年龄分:
- 25-50 岁积累期:80-100% 股票。Drawdown 是买入机会。defender 问题在这阶段几乎不重要。5-10% GLD sleeve 可以加,但不是必须的。
- 50-65 岁接近提取期:60% SPY + 30% defender + 10% 现金。defender 应该是混合的,不是单押:15% GLD + 10% IEF + 5% TIP。多种 hedge 抗多种危机类型。
- 65+ 提取期:40-50% SPY + 40-50% defender + 10-20% 现金(够覆盖 2 年开销)。Sequence-of-returns risk 占主导。Smoothness 比 CAGR 更值钱。
- 把 TLT 从默认债券配置里去掉。换 IEF(中期)或 AGG(宽基)。长 duration 在 1981-2020 是个 tailwind,2022 之后变成 Fed 决策的硬币翻面。
- 黄金当结构性 defender,不是战术性押注。10-20% 仓位。每季度 rebalance 防漂移。
- Crypto 控制在 5% 以下。不是对冲,是低 normal-regime 相关性的 return enhancer。
- GLD、TIP、TLT 优先放税务优惠账户。税差异是实实在在的。
- 每 5 年重新评估。Defender 有效性取决于利率 regime——下个 10 年的答案不会等于过去 10 年的答案。
一些技术细节
- 17 年窗口里 ZIRP + 加息倒挂占主导。2009 年之前(高利率、常规相关性)这些 defender 的排名可能不一样。把 TLT 和 GLD 回溯到各自 inception(TLT: 2002,GLD: 2004)是后续 experiment 候选。
- 黄金最近 7 年的强势是 regime-dependent,不代表长期。起始 2024 的 30% CAGR 不要外推。
- 季度 rebalance。其他频率(月度、半年、threshold-based)会让相关性略变,但不会改变排序。
- MSTR 是 BTC 代理不是 BTC 本身。它 2022 年 −43% 高估了 BTC 实际跌幅。
- 加 TIP 是个明显的下一步。
- SH 是 daily-reset 的,单独长期持有会漏血。60/40 里季度 rebalance 部分补偿这个问题,但 SH 长期还是泄血。
文件
experiments/exp_39_diversifier_matrix.py-
summary.csv— 全部 Sharpe / MaxDD / 相关性 -
year_2022.csv— 2022 诊断年 drawdown -
windowed_perf.csv— 1-5y rolling 分布 -
recent_starts.csv— 起始 2019-2024 各窗口 -
plots/sharpe_vs_maxdd.png— Pareto 散点 -
plots/drawdown_2022.png— 2022 MaxDD 柱图 -
plots/equity_curves.png— top-5 vs SPY -
plots/cagr_by_start_year.png— 最近 CAGR 对比
English
In 2022 something happened that wasn’t supposed to: the textbook 60/40 (the default retirement allocation for decades — 60 % equities + 40 % bonds; here specifically 60 % SPY = S&P 500 index ETF + 40 % TLT = iShares 20+ Year Treasury ETF) lost 23 % on the year — four percentage points worse than holding 100 % SPY. The bond leg was supposed to be there because stocks crash; it lost more than the thing it was insuring.
The mechanism isn’t subtle. Inflation hit 9 %, the Fed pulled rates from 0 % to 5 % in a year, stocks fell (future cash flows discounted harder) and long bonds fell (coupon discount rate jumped), and two theoretically uncorrelated assets got made correlated by inflation. But that was the first time in forty years. “60/40 + long bonds” has been the default retirement portfolio for decades; nobody thought it had a problem before 2022. Watching your “conservative” allocation underperform pure equity in a down year is, for someone near retirement, a hard thing to absorb.
The natural follow-up: if bonds aren’t the right hedge anymore, what should the 40 % be?
I ran 13 candidates — Treasuries at various durations, broad bond indices, gold, silver, broad commodities, oil, low-volatility equity, equal-weight S&P, crypto proxy, inverse SPY — across 17 years (2009-2026), and looked at every recent starting point.
The short version
Starting at the beginning of 2019, a 60/40 with gold (60 % SPY + 40 % GLD) has compounded at 18.6 % a year. The same starting point with long bonds (60/40 TLT) returned 10.1 %. Plain 100 % SPY returned 17.6 %.
Read that again. The gold-based 60/40 beat the bond-based 60/40 AND beat 100 % equity-only, while taking a drawdown 34 % shallower than 100 % SPY (−22 % vs −34 %). This is the cleanest “diversification actually works” result in this repo — but specifically for gold, not bonds.
A few terms
- CAGR — annualized compound return.
- MaxDD — worst peak-to-trough loss along the way.
- Sharpe — return per unit of volatility. Above 1 is genuinely good.
- Correlation with SPY — how much the defender moves with stocks. Close to zero or negative is what you want from a hedge; close to +1 means it’s just stocks in disguise.
- Sequence-of-returns risk — when you’re withdrawing, the order of returns matters more than the median. Same 30-year average return can mean retirement comfort or ruin depending on whether the bad years come early or late.
What the 13 candidates actually are
You’ve seen these names on Bogleheads and Reddit. Here’s what each one is:
- TLT (iShares 20+ Year Treasury Bond ETF). Long-duration US Treasuries, duration ~17 years. Expense ratio 0.15 %. The textbook 60/40 default. Problem: the longer the duration, the bigger the rate-shock damage — in 2022 it acted as a risk amplifier, not a hedge.
- IEF (iShares 7-10 Year Treasury Bond ETF). Intermediate duration, ~7 years. Expense 0.15 %. Lost about half what TLT lost in 2022 (−15 % vs −31 %).
- SHY (iShares 1-3 Year Treasury Bond ETF). Short duration, ~2 years. Basically cash + a sliver of carry. Almost no duration risk in hiking cycles.
- AGG (iShares Core US Aggregate Bond ETF). The broad US bond market — Treasuries + investment-grade corp + MBS, weighted. Duration ~6-7 years. Expense 0.03 % (cheapest in the table).
- GLD (SPDR Gold Shares). Gold-backed ETF with physical bullion in a vault. Expense 0.40 % (mid-range for gold ETFs). One of the largest non-stock-non-bond ETFs, ~$80 B AUM. The only asset that holds value in both inflationary and deflationary crises.
- SLV (iShares Silver Trust). Silver ETF. Much more volatile than gold, more industrial exposure (semiconductors, solar). Correlated with gold but ~1.5-2× the beta.
- DBC (Invesco DB Commodity Index). Broad commodities — oil, energy, industrial metals, agriculture, weighted. Expense 0.85 %. Issues a K-1 tax form.
- USO (United States Oil Fund). WTI oil proxy via near-month futures rolling (subject to contango drag). Expense 0.79 %. Extremely volatile.
- MSTR (MicroStrategy). We don’t have clean long-history BTC data, so we use MSTR (a public company that holds large BTC reserves) as a proxy. MSTR is not pure BTC — its stock is more volatile than BTC itself (in 2022 MSTR dropped 75 % while BTC dropped 65 %).
- USMV / SPLV (iShares MSCI USA Min Vol / Invesco S&P 500 Low Volatility). Two low-volatility equity ETFs — they pick the lowest-vol names from the S&P 500. Expense 0.15 % / 0.25 %.
- RSP (Invesco S&P 500 Equal Weight ETF). Holds the 500 S&P names at equal weights instead of market-cap weights, so it has more small-cap exposure than SPY. Expense 0.20 %.
- SH (ProShares Short S&P 500). −1× SPY inverse ETF. Daily-reset — structural decay over long holds (it bleeds in any market with a positive drift).
Backtest structure
For each candidate, 60 % SPY + 40 % defender, rebalanced quarterly to target weights. Window: January 2009 to May 2026 (17 years). Each pair’s start is the later of 2009 or the candidate’s launch date.
17-year ranking (sorted by Sharpe)
| Portfolio | CAGR | Sharpe | MaxDD | Calmar | SPY corr | $100k → |
|---|---|---|---|---|---|---|
| 60/40 GLD | 13.3 % | 1.04 | −22 % | 0.60 | 0.06 | $877 k |
| 60/40 SH | 3.6 % | 1.02 | −7 % | 0.49 | −1.00 | $186 k |
| 60/40 IEF | 10.1 % | 1.00 | −21 % | 0.47 | −0.26 | $528 k |
| 60/40 TLT | 9.9 % | 0.96 | −28 % | 0.36 | −0.29 | $517 k |
| 60/40 AGG | 10.1 % | 0.95 | −21 % | 0.48 | 0.00 | $532 k |
| 60/40 USMV | 13.8 % | 0.94 | −33 % | 0.41 | 0.89 | $657 k |
| 60/40 SHY | 9.6 % | 0.93 | −20 % | 0.49 | −0.13 | $490 k |
| 100 % SPY | 14.8 % | 0.86 | −34 % | 0.44 | 1.00 | $1.09 M |
| 60/40 MSTR | 23.7 % | 0.82 | −59 % | 0.40 | 0.42 | $4.0 M |
Three orderings to notice:
- 60/40 GLD beats 60/40 TLT on every metric — Sharpe (1.04 vs 0.96), MaxDD (−22 % vs −28 %), CAGR (13.3 % vs 9.9 %), Calmar (0.60 vs 0.36). Gold’s correlation with SPY (0.06) is closer to zero than TLT’s (−0.29), and more importantly, it stays stable across regimes — TLT goes negative in deflation, positive in inflation, so it’s not actually a reliable hedge.
- The Sharpe 1.0+ tier is GLD, SH, IEF — gold, inverse SPY, intermediate bonds. The textbook TLT long bond is in the second tier.
- 100 % SPY beats 6 of the 13 60/40 portfolios on Sharpe. The textbook claim “add bonds for risk-adjusted return” only works at GLD, SH, IEF, AGG, USMV, SHY — and the only one that beats SPY on BOTH Sharpe AND MaxDD is GLD.
Recent 1-5 year reality — the chart that matters
| Started | 100 % SPY | 60/40 TLT | 60/40 IEF | 60/40 AGG | 60/40 GLD | 60/40 MSTR |
|---|---|---|---|---|---|---|
| 2019 | 17.6 % | 10.1 % | 11.2 % | 11.5 % | 18.6 % | 37.7 % |
| 2020 | 15.5 % | 7.9 % | 9.6 % | 9.8 % | 17.4 % | 40.0 % |
| 2021 | 15.5 % | 5.9 % | 8.5 % | 9.2 % | 16.7 % | 33.0 % |
| 2022 | 12.1 % | 3.9 % | 6.9 % | 7.4 % | 17.2 % | 32.3 % |
| 2023 | 23.5 % | 13.4 % | 15.1 % | 15.6 % | 27.2 % | 68.6 % |
| 2024 | 22.5 % | 12.5 % | 14.6 % | 14.9 % | 30.3 % | 46.7 % |
Three things to internalize:
1. 60/40 GLD beat 100 % SPY in every recent window. Read it again. Over the last 2-7 years, holding 40 % in gold and 60 % in stocks earned more than holding 100 % stocks. With shallower drawdowns:
| Started | 100 % SPY MaxDD | 60/40 GLD MaxDD |
|---|---|---|
| 2019 | −34 % | −22 % |
| 2022 | −25 % | −19 % |
| 2024 | −19 % | −12 % |
2. 60/40 TLT lagged 100 % SPY by 5-10 percentage points in every recent window. The “diversification cost” has been enormous in the last 5 years. The 60/40 TLT starting 2022 earned 3.9 % CAGR — over a stretch when cash paid about 5 %. The “safe” allocation underperformed cash.
3. Gold has been on a tear the last 3 years. The 60/40 GLD starting 2024 returned 87 % over 2.4 years. Central-bank buying, geopolitical tension, US dollar worries all converged. Don’t extrapolate — for long-run expectations, look at the 17-year ranking table.
2022 — the diagnostic year
Aggregate numbers can hide what happened. Look at what each portfolio did in 2022:
| Portfolio | 2022 MaxDD | 2022 total return |
|---|---|---|
| 60/40 MSTR | −43 % | −42 % |
| 60/40 TLT | −27 % | −23 % |
| 100 % SPY | −25 % | −19 % |
| 60/40 AGG | −21 % | −16 % |
| 60/40 IEF | −21 % | −17 % |
| 60/40 USO | −20 % | +0.1 % |
| 60/40 GLD | −19 % | −11 % |
| 60/40 DBC | −17 % | −4 % |
| 60/40 SH | −5 % | −3 % |
The headline shock: the textbook 60/40-with-long-bonds dropped MORE than 100 % SPY in 2022. The hedge became a risk amplifier. Anyone running standard 60/40 TLT in retirement that year took 2 percentage points of extra drawdown for the privilege of “diversifying.”
The 2022 winners were the inflation-sensitive real assets: GLD (−19 %), DBC (−17 %), USO (the only major asset that finished positive).
Mechanism: when inflation rises and the Fed raises rates aggressively, stocks fall (future cash flows discount harder) AND long bonds fall (the discount rate on their coupons just jumped). The two assets that were supposed to be uncorrelated turn out to be correlated through inflation. Gold doesn’t depend on the nominal rate, so its hedge mechanism survives.
Why gold works when bonds don’t
Bonds and gold are both called “safe-haven” assets, but the mechanism is different:
- Bonds work in deflationary recessions — bank crisis, COVID-style demand shock. Fed cuts rates → bonds rise → hedge engages.
- Gold works in inflationary shocks — oil shock, currency debasement, fiscal expansion. Fed raises rates → bonds get crushed → but gold rises because money is being printed faster than gold can be mined.
2009-2020 was dominated by deflationary worry. Bonds were the right hedge. 2022-2025 has been dominated by inflationary shock. Gold has been the right one. You don’t know which kind of crisis is next. Carrying both hedges (some bonds, some gold) covers either case. Carrying only bonds leaves the inflation case exposed.
Gold is the closest thing in this study to an all-weather hedge — it works in deflationary panics (as a store of value) and inflationary shocks (as a hard asset).
Sharpe vs CAGR — depends on your age
The table tells two different stories depending on which metric matters:
25-50 years old, in accumulation (contributing monthly for the next 30+ years) — CAGR matters more. 100 % SPY’s CAGR edge compounds to 30 % more wealth over 30 years. You can sit through a −34 % drawdown because you have 30 years to recover.
50-65 years old, approaching withdrawal — Sharpe matters more. A 35 % drawdown in year 1 of retirement is catastrophic because you’re selling shares at the bottom to fund living expenses. The 60/40 GLD’s shallower drawdown is exactly the protection that keeps your withdrawal plan from breaking.
This is sequence-of-returns risk — the order of returns matters when you’re drawing down, even though it doesn’t matter when accumulating. Same 30-year average return can lead to ruin if the bad years come early or comfort if they come late.
No single best 60/40 substitute — depends on whether you’re accumulating or withdrawing.
TIPS — the defender we missed
TIPS (Treasury Inflation-Protected Securities) = iShares TIPS Bond ETF (TIP). Principal adjusts with CPI: 5 % inflation, principal rises 5 %, plus a real yield (~1-2 % right now).
We didn’t include TIP in the backtest because its ETF history is slightly shorter than the others. But in the 2022 stress test, TIP returned about −12 % — much better than TLT (−31 %) or IEF (−15 %). TIPS is structurally built for inflation regimes, which is exactly what broke 60/40 in 2022.
Likely ranking with TIP included:
- GLD (still best for Sharpe)
- TIP (cleanest inflation hedge)
- IEF / AGG (intermediate nominal bonds)
- TLT (long nominal — dangerous in inflation)
Adding TIP to the matrix is a future-experiment candidate.
What about Bitcoin?
BTC (or MSTR as a proxy) gets pitched as “digital gold” — uncorrelated store of value. Actual data:
- Normal markets: BTC’s correlation with SPY runs 0.0-0.3. Looks uncorrelated, almost like gold.
- Tail risk events: correlation spikes toward +1. March 2020, BTC fell 50 % in two days while SPY fell 34 %. Q1 2022, BTC fell 45 % while SPY fell 10 %.
So BTC is not a tail-risk hedge. It’s a high-beta exposure that happens to be uncorrelated in calm markets and dangerously correlated in crises. The opposite of what you want from a defender.
If you want crypto exposure: 0-5 % position (return enhancer, not defender). A 60/35/5 SPY/GLD/BITO is reasonable. A 60/40 SPY/BITO is not.
Another option: leveraged 60/40
Worth mentioning a non-standard approach — leveraged 60/40. WisdomTree’s NTSX ETF holds 90 % SPY + 60 % Treasury futures (= 150 % total exposure), rebalanced daily. The idea: a 60/40 uses 100 % of capital for 90 % stocks + 60 % bonds exposure = 150 % total — you can save 100 % of capital for cash collateral.
Pros: same risk-adjusted return as 60/40 but CAGR closer to 100 % SPY because of 1.5× total exposure. Cons: daily rebalance has vol drag (same mechanism as leveraged ETFs); inflation shocks compound losses on both legs.
If you believe in 60/40‘s Sharpe edge but don’t want to give up the CAGR — NTSX is an interesting product. Not tested in this backtest, but worth flagging as a “non-standard 60/40” option.
Tax wrinkles by defender
| Defender | Taxable account |
|---|---|
| TLT, IEF | Coupon income taxed at ordinary rate annually |
| GLD | LTCG at 28 % (collectibles rate), not the usual 15-20 % |
| DBC | Issues K-1, complex |
| BITO | 60/40 LTCG/STCG split regardless of holding period (futures rule) |
| HYSA cash | Ordinary income on interest |
Gold’s 28 % collectibles rate eats some of its Sharpe edge in a taxable account. In an IRA the gap disappears. Same recurring lesson: defenders belong in tax-advantaged accounts.
What I would actually do
By age:
- 25-50, accumulating: 80-100 % equities. Drawdowns are buying opportunities. The defender question barely matters at this stage. A 5-10 % GLD sleeve is reasonable, not required.
- 50-65, approaching withdrawal: 60 % SPY + 30 % defender + 10 % cash. Defender should be a mix, not a single bet: 15 % GLD + 10 % IEF + 5 % TIP. Multiple hedges against multiple crisis types.
- 65+, withdrawing: 40-50 % SPY + 40-50 % defender + 10-20 % cash for two years of expenses. Sequence-of-returns risk dominates. Smoothness more valuable than CAGR.
- Drop TLT as your default bond allocation. Use IEF (intermediate) or AGG (broad) instead. Long duration was a tailwind from 1981-2020 and is now a coin flip on the Fed.
- Hold gold as a structural defender, not tactical. 10-20 % of portfolio. Quarterly rebalance to prevent drift.
- Keep crypto under 5 %. Not a hedge. A return enhancer with low normal-regime correlation and dangerous crisis correlation.
- Run GLD / TIP / TLT in tax-advantaged accounts first. The tax difference is real.
- Reconsider every 5 years. Defender effectiveness depends on the rate regime. The right answer for 2026-2031 won’t be identical to the answer for 2021-2026.
Boring stuff
- The 17-year window is dominated by ZIRP and the rate-hike inversion. Pre-2009 (high rates, normal correlations) might rank these defenders differently. Extending TLT and GLD back to inception (TLT: 2002, GLD: 2004) is a candidate follow-up.
- Gold’s last 7 years are regime-dependent — the 30 % CAGR of 60/40 GLD starting 2024 is not a long-run expectation, just a window.
- Quarterly rebalance. Other cadences would shift correlations slightly but not flip the ranking.
- MSTR is a BTC proxy, not BTC itself. Its 2022 drawdown (−43 %) overstates BTC’s actual decline.
- Adding TIP is an obvious next step.
- SH is daily-reset and bleeds on long holds. The 60/40 quarterly rebalance partially compensates, but long-run SH still leaks.
Files
experiments/exp_39_diversifier_matrix.py-
summary.csv— full Sharpe / MaxDD / correlation per defender. -
year_2022.csv— 2022 diagnostic-year drawdowns. -
windowed_perf.csv— rolling 1-5y window distributions. -
recent_starts.csv— CAGR/MaxDD by start year 2019-2024. -
plots/sharpe_vs_maxdd.png— Pareto scatter. -
plots/drawdown_2022.png— 2022 MaxDD bars. -
plots/equity_curves.png— top-5 vs SPY. -
plots/cagr_by_start_year.png— recent CAGR comparison.